
Metric calculations
How the core project metrics are calculated.
This page explains how the metrics on the financial forecast chart, the resource forecast chart, the financial section of the project overview page, and the resource totals on the project schedule are calculated.
Financial forecast chart
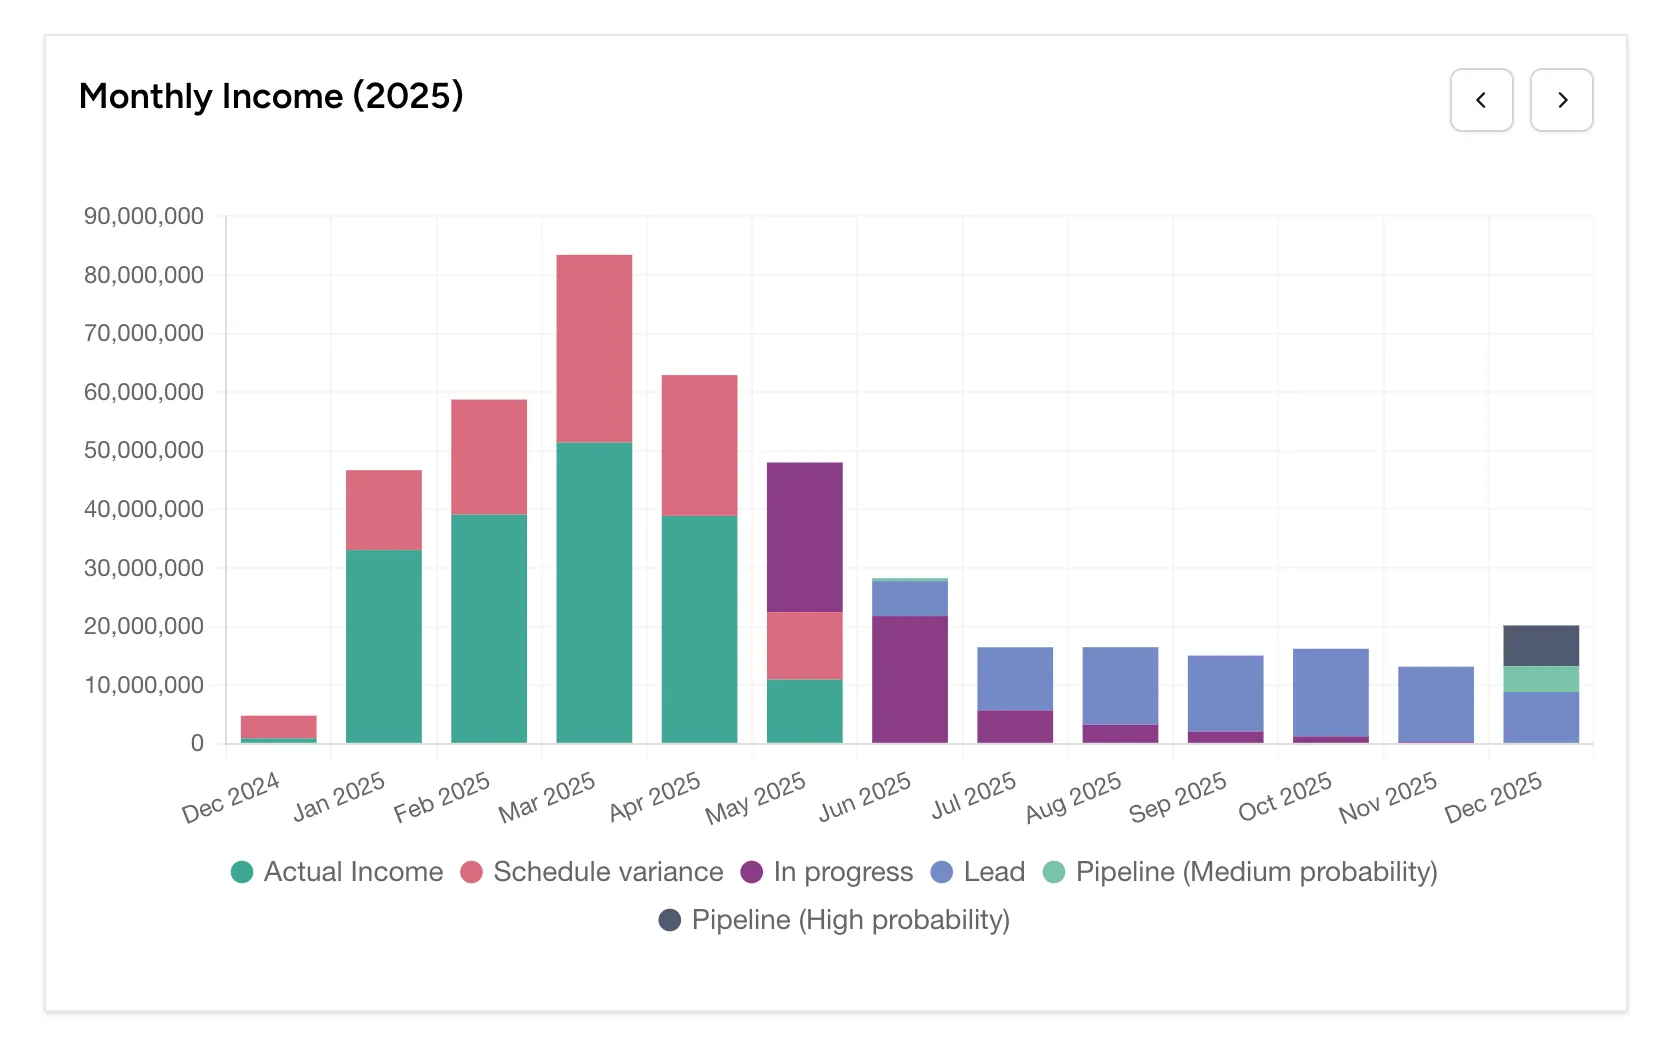
The financial forecast values use the following calculations:
- Actual income:
- Schedule variance:
- In progress:
- Lead:
- Pipeline, medium probability:
- Pipeline, high probability:
Project overview financials
The cards on the project overview page use the following calculations:

- Invoiced value: The sum of what the invoices billed, priced from the rates frozen onto each invoice.
- Gross profit:
- Compliance to plan:
Project schedule value totals
Value on the project schedule is priced from the live rate, and a project rate is held per week. Each week’s value is therefore its own hours at the rate that applied in that week:
- Forecast value:
- Actual value:
- Baseline value:
The figure in the totals column is a shortcut rather than the sum of those weekly values: it is the resource’s total hours multiplied by their current rate. For a resource whose rate stepped partway through the project, the two do not agree, and the weekly figures are the ones that reflect what each week cost.
The schedule does not show an invoiced value of its own. What it shows for billing is the Invoiced percentage in the variance cell, which is the resource’s invoiced hours as a percentage of their actual hours. For what an invoice billed, use the invoiced value on the project overview, which is priced from the rates each invoice froze rather than from the live rate. See understanding rate changes for which figures a rate change does and does not restate.