Appearance
Dashboard statistics
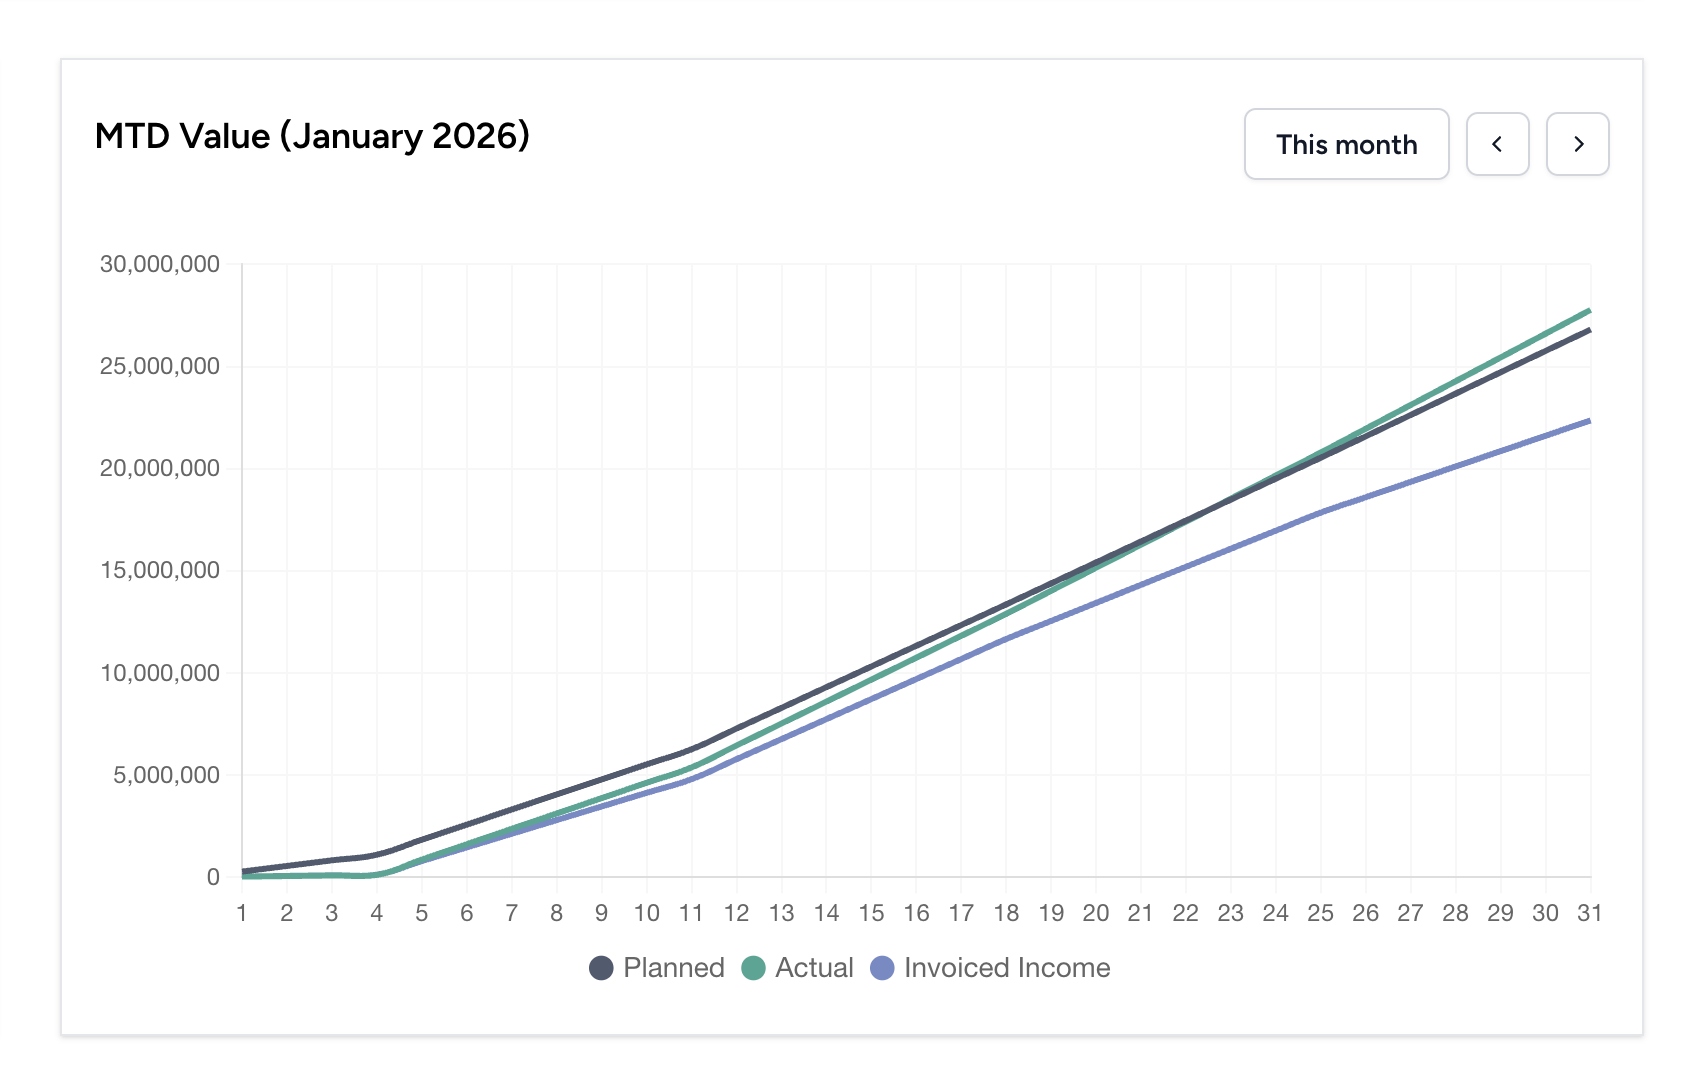
MTD value
These values are only calculated using projects that are in the status In progress.
Monthly income
Values for the categories on the monthly income are calculated only for project statuses that are in progress, sold or pipeline.
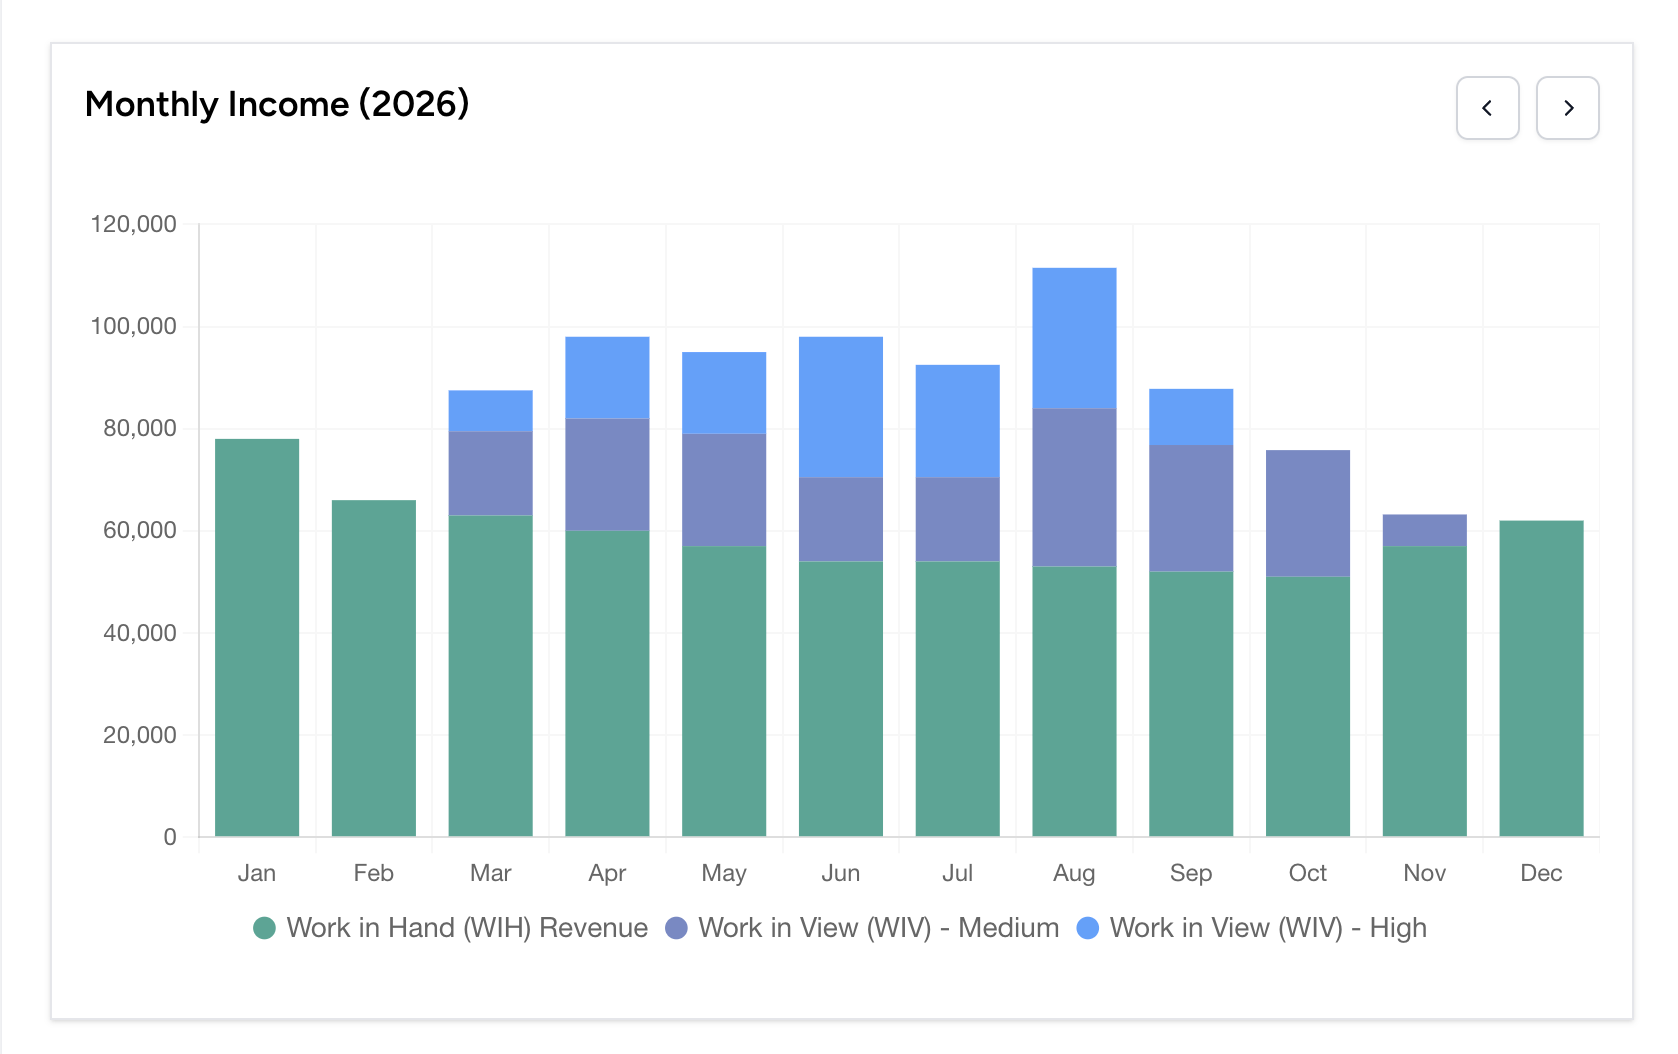
The project statuses map to the values in the following way:
- Work in Hand (WIH) Revenue: PO value for projects in the Sold and In Progress phases.
- Work in View (WIV) - Medium: PO value for projects in the pipeline phase with medium win probability.
- Work in View (WIV) - High: PO value for projects in the pipeline phase with high win probability.
Resource forecasting
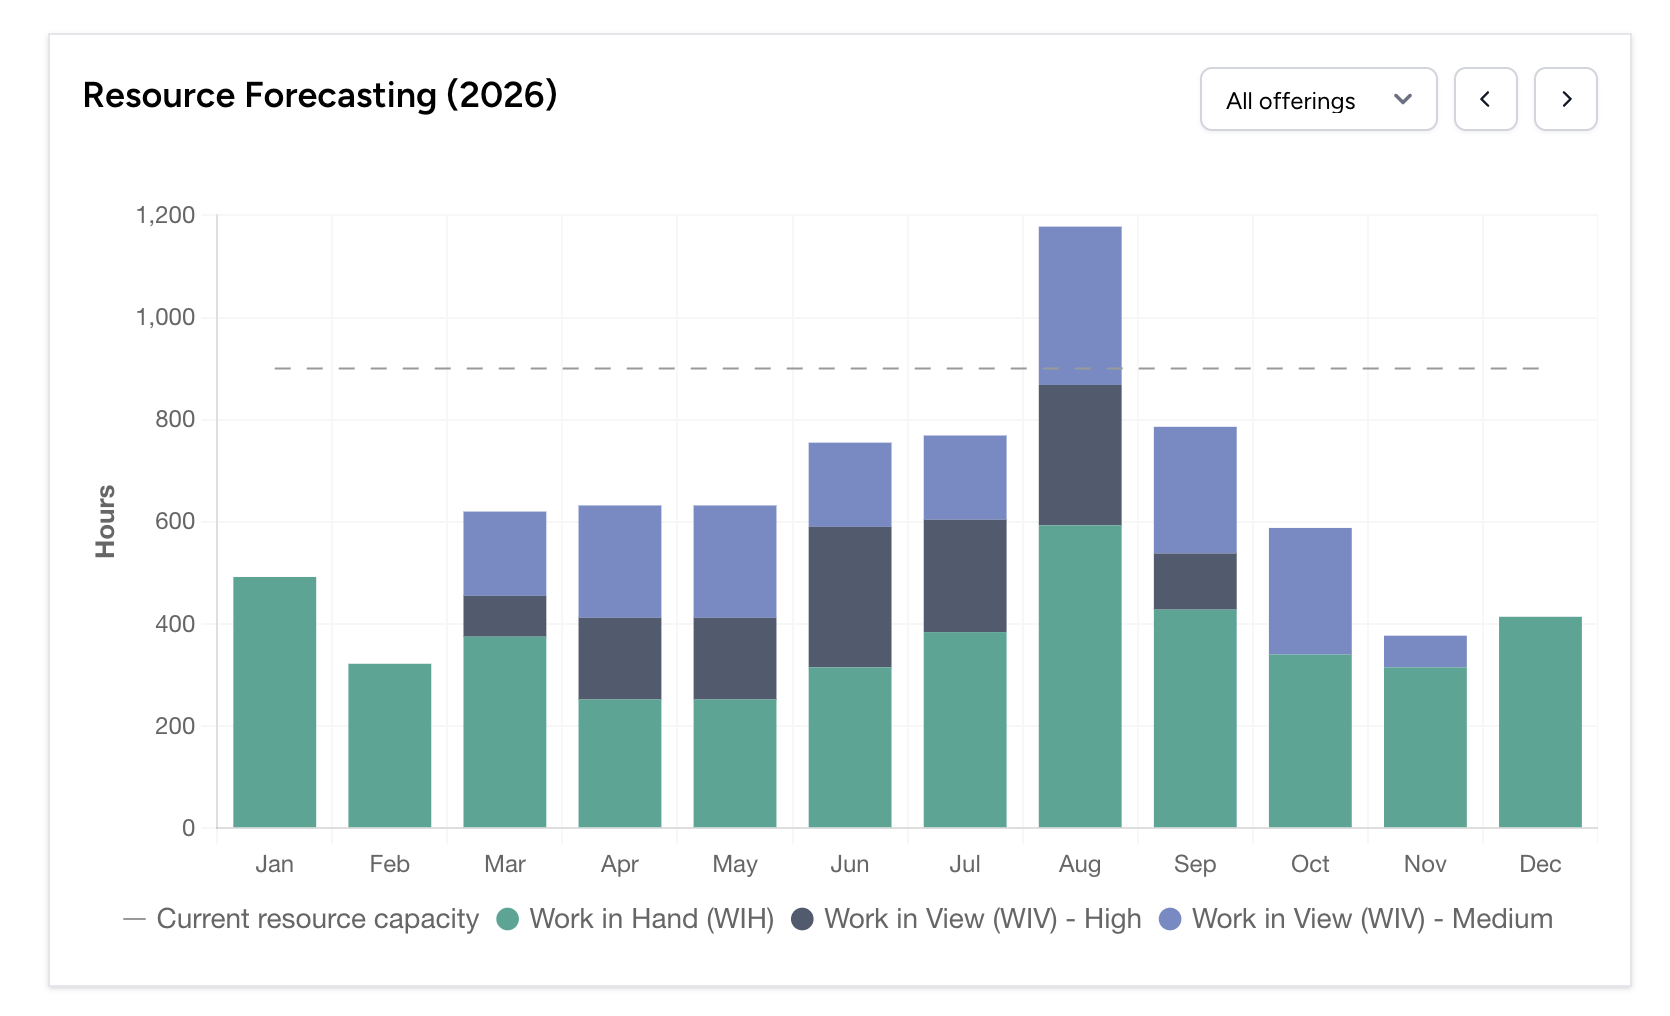
Work in Progress: Planned hours for projects sold or in progress.
Work in View (High probability): Planned hours for pipeline projects with high win probability.
Work in View (Medium probability) Planned hours for pipeline projects with medium win probability.
Current resource capacity: Current capacity on all active users. This is calculated using the formula:
20 is used as a standard monthly working-days approximation.
Work at risk
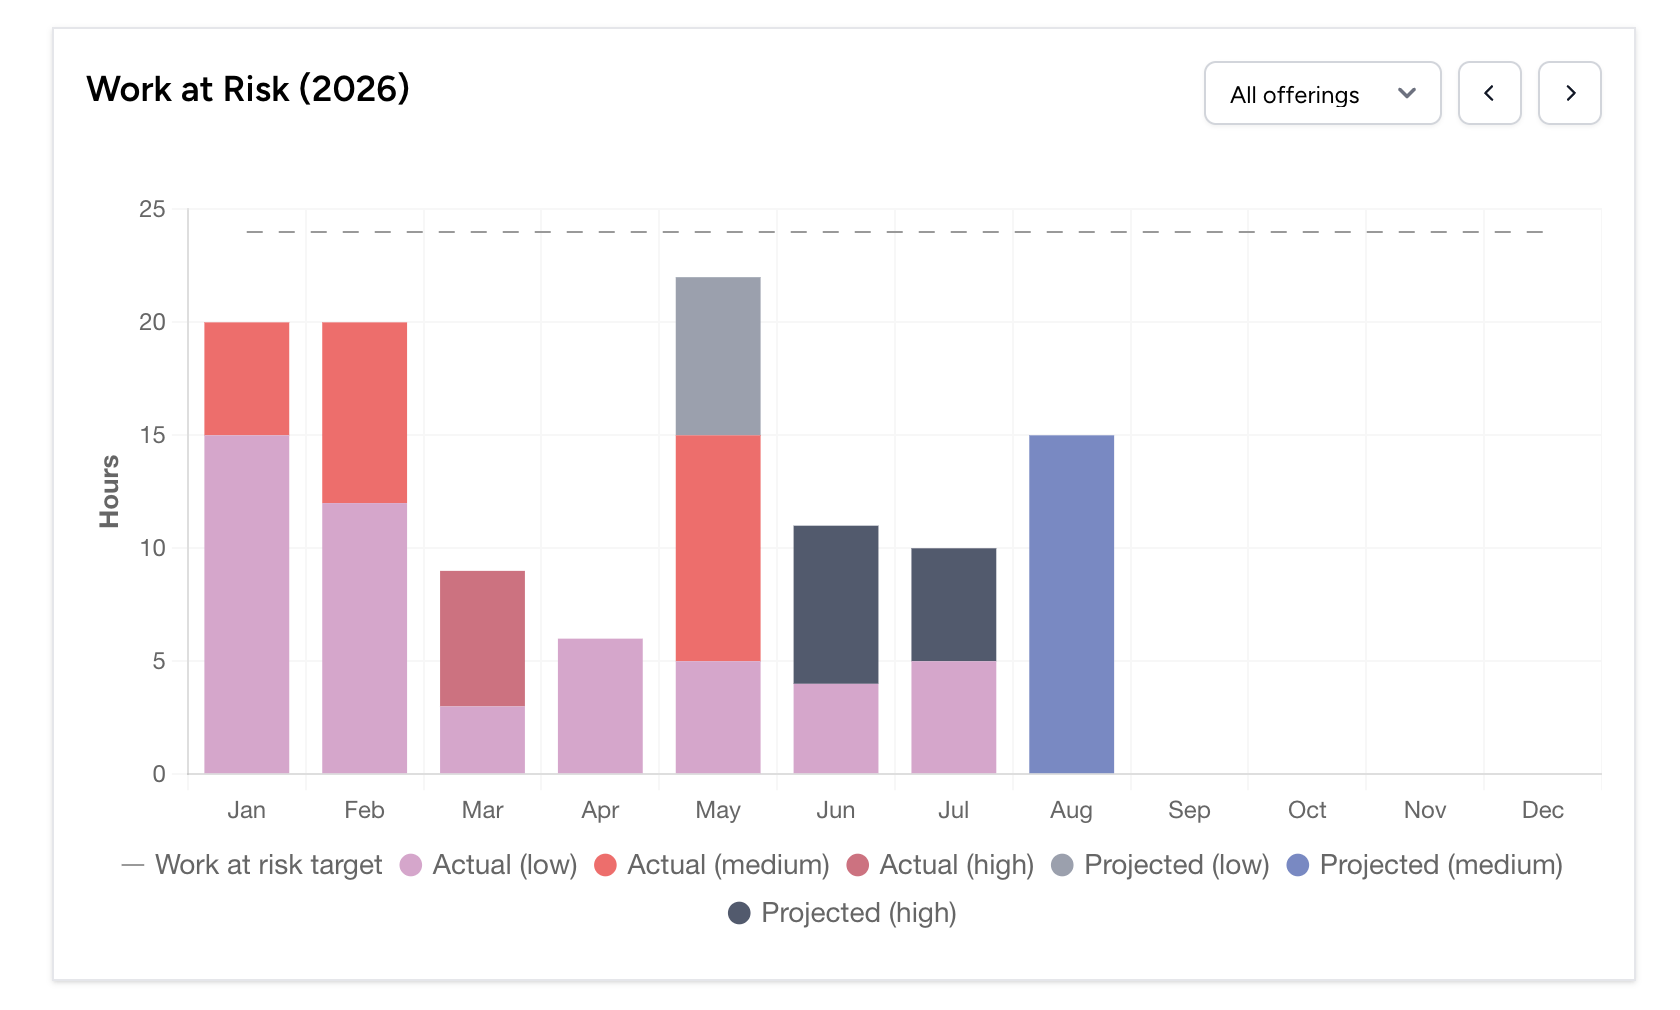
- Actual (low): Actual hours for projects with low win probability.
- Actual (medium): Actual hours for projects with medium win probability.
- Actual (high) Actual hours for projects with high win probability.
- Projected (low): Planned hours for projects with low win probability.
- Projected (medium): Planned hours for projects with medium win probability.
- Projected (high) Planned hours for projects with high win probability.
- Work at risk target: The target that is used to ensure work at risk remains below an acceptable limit. This is calculated using the formula:
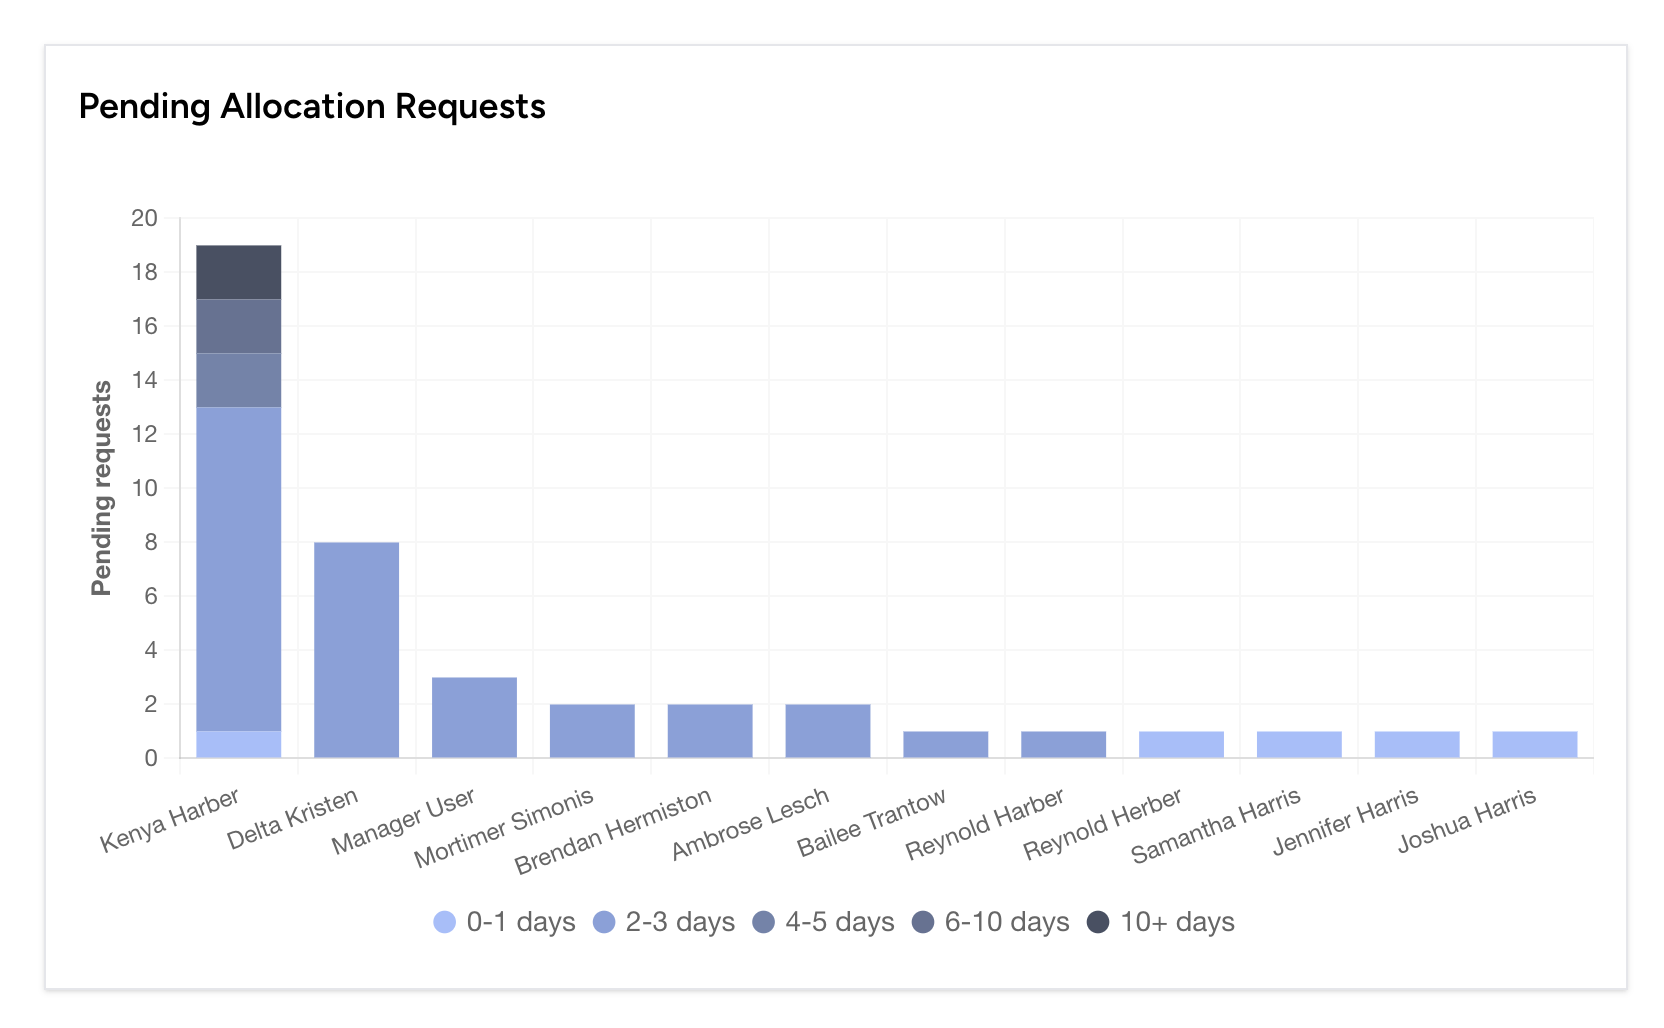
Pending allocation requests
The values on this chart are sorted by the total number of unapproved allocation requests for RMs. The chart is categorized by the number of days pending.