Appearance
Metric calculations
This page provides a guide of how metrics are calculated on the monthly income chart, resource forecast chart and the financial section of the project overview page.
Monthly income chart
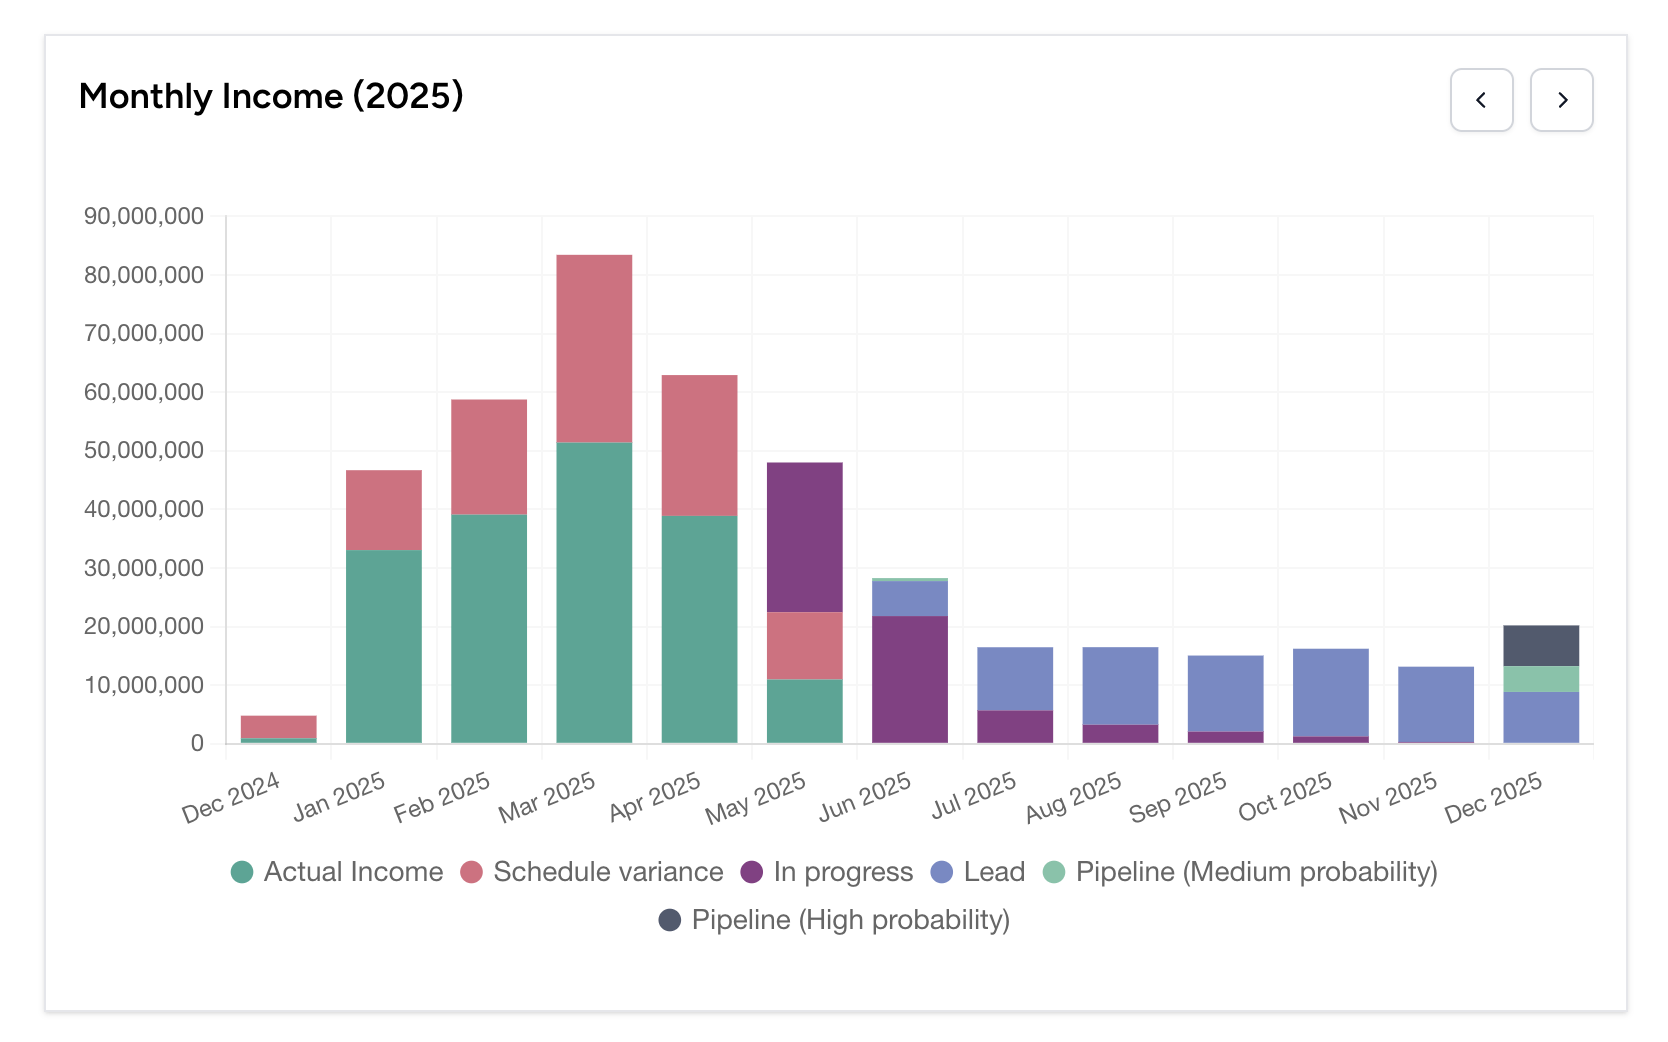
- Actual Income =
- Schedule variance =
- In progress =
- Lead =
- Pipeline (Medium probability) =
- Pipeline (High probability) =
Project overview financials
For these cards in the project overview page:

The values are calculated in this way:
- Invoiced value =
- Gross profit =
, where internal cost = . - Compliance to plan =