Appearance
Track resource utilization
Resource managers have two options for tracking utilization for their resources:
Utilization Report
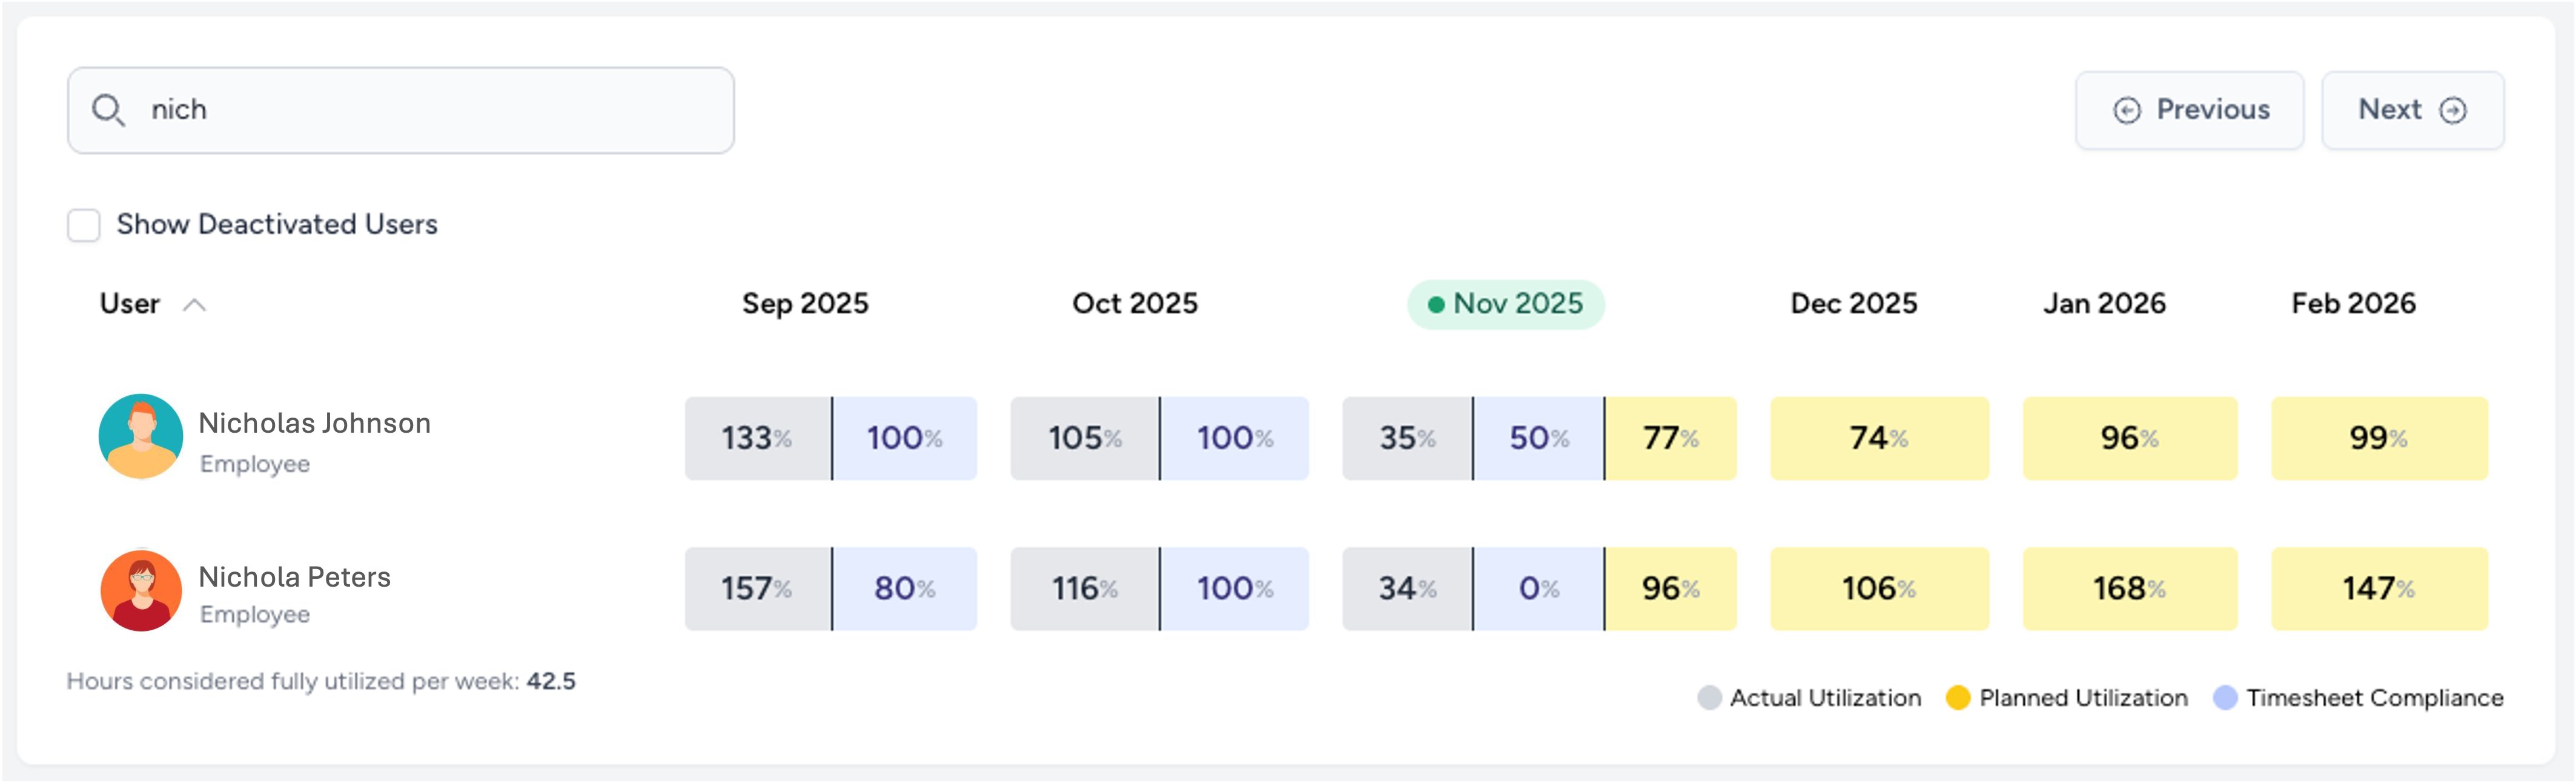
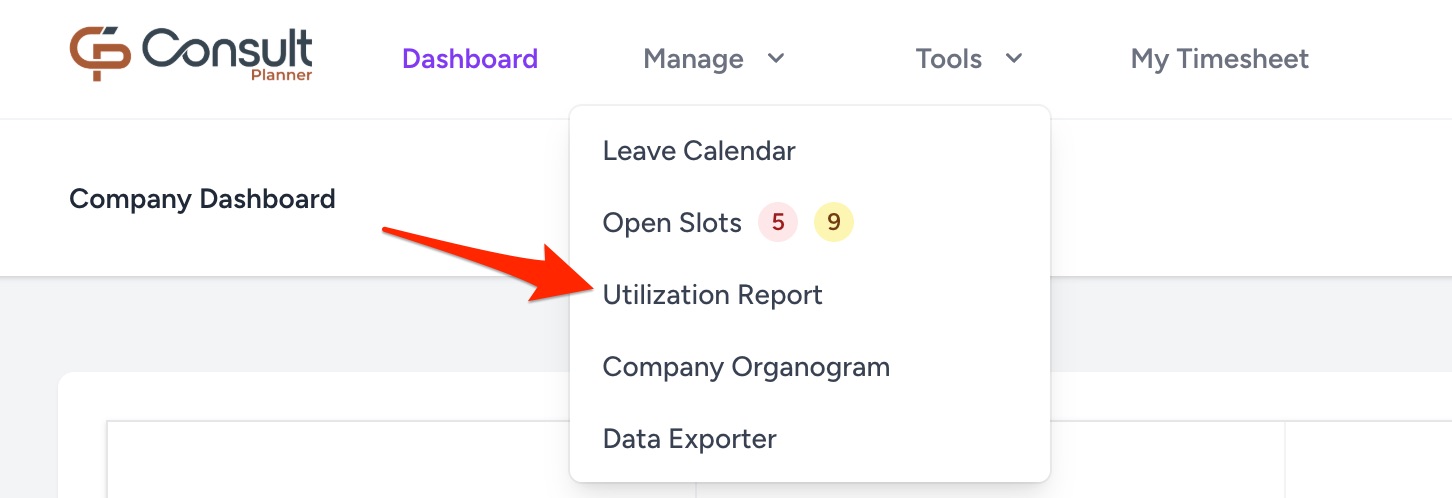
On this report, you can search for any users to see how utilized they have been and how their planned utilization looks for the upcoming months. The utilization report is accessed here:
For each user, you can then see the following:
Past month utilization

The two values shown for past months are:
- Actual Utilization (grey): The total hours worked by the user divided by the total number of required hours.
- Timesheet Compliance (blue): The number of approved timesheets divided by the total number of timesheets for that month.
Current month utilization

The three values shown for the current month are:
- Actual Utilization (grey): The total hours worked by the user divided by the total number of required hours, for days in the past.
- Timesheet Compliance (blue): The number of approved timesheets divided by the total number of timesheets for that month, for weeks in the past.
- Planned Utilization (yellow): The planned hours on projects divided by the total number of required hours, for days in the future.
Future month utilization

Only the Planned Utilization is shown for future months, which is the planned hours on projects divided by the total number of required hours for those months.
To understand more about how these values are generated, refer to utilization calculations.
RM Dashboard
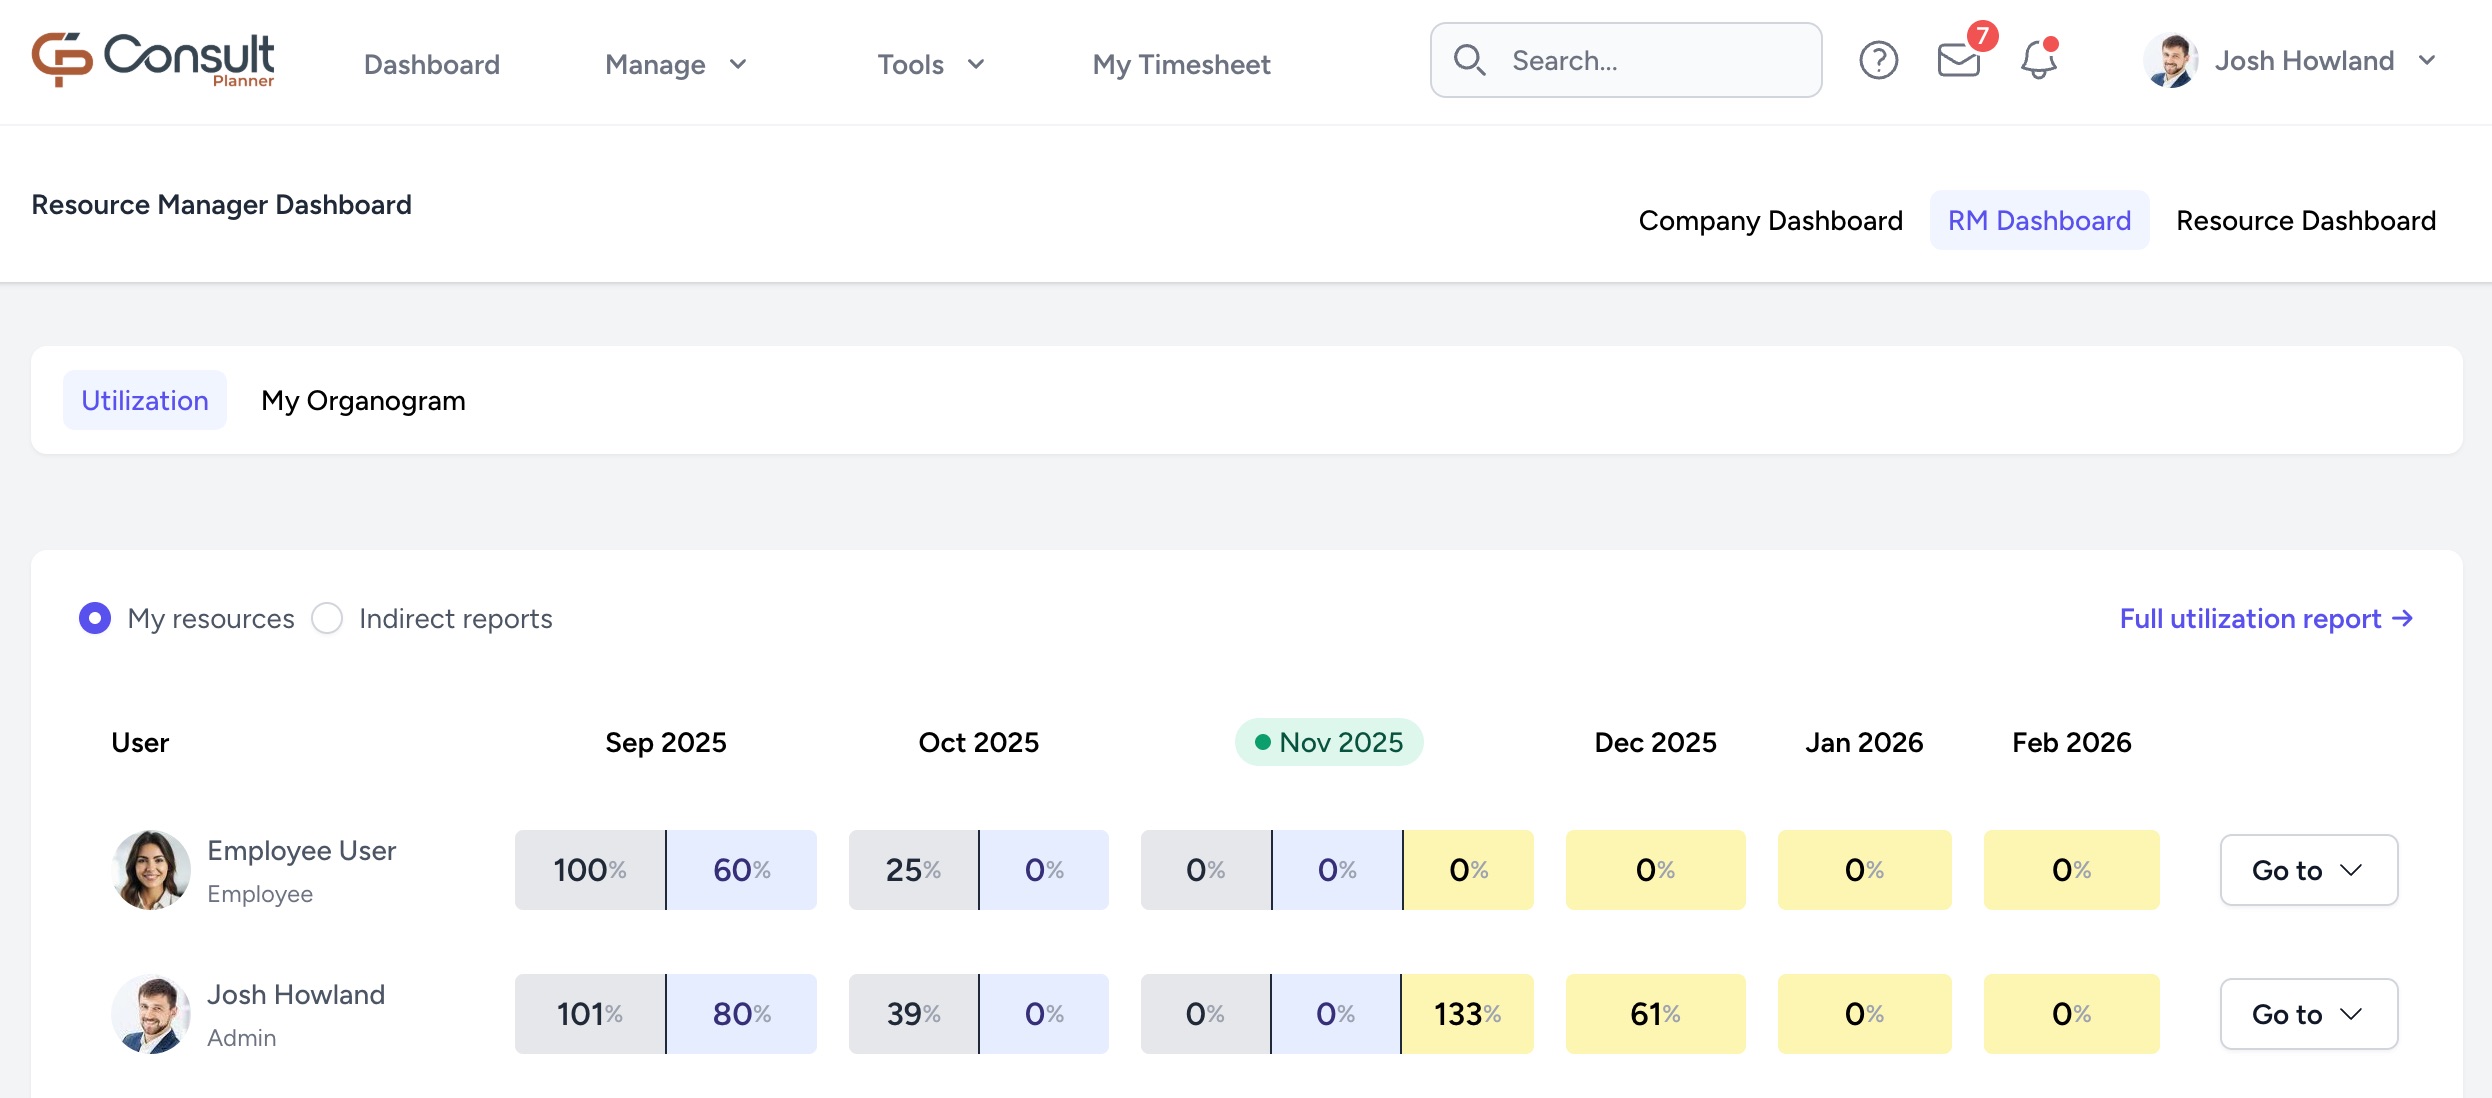
The second tool that resource managers have is the RM Dashboard, which presents information specific to their direct and indirect reports (see Glossary for definitions).
The RM dashboard is only available to users who are resource managers to other users, and it can be accessed by going to Dashboard > RM Dashboard.
RM Dashboard | Utilization
This is a filtered view of the Utilization Report, showing only the resources applicable to you.
It also includes access to the projects and timesheets of those users:
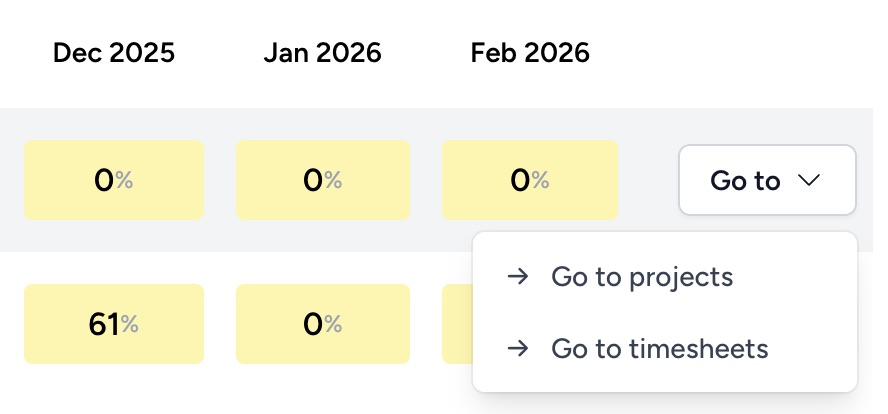
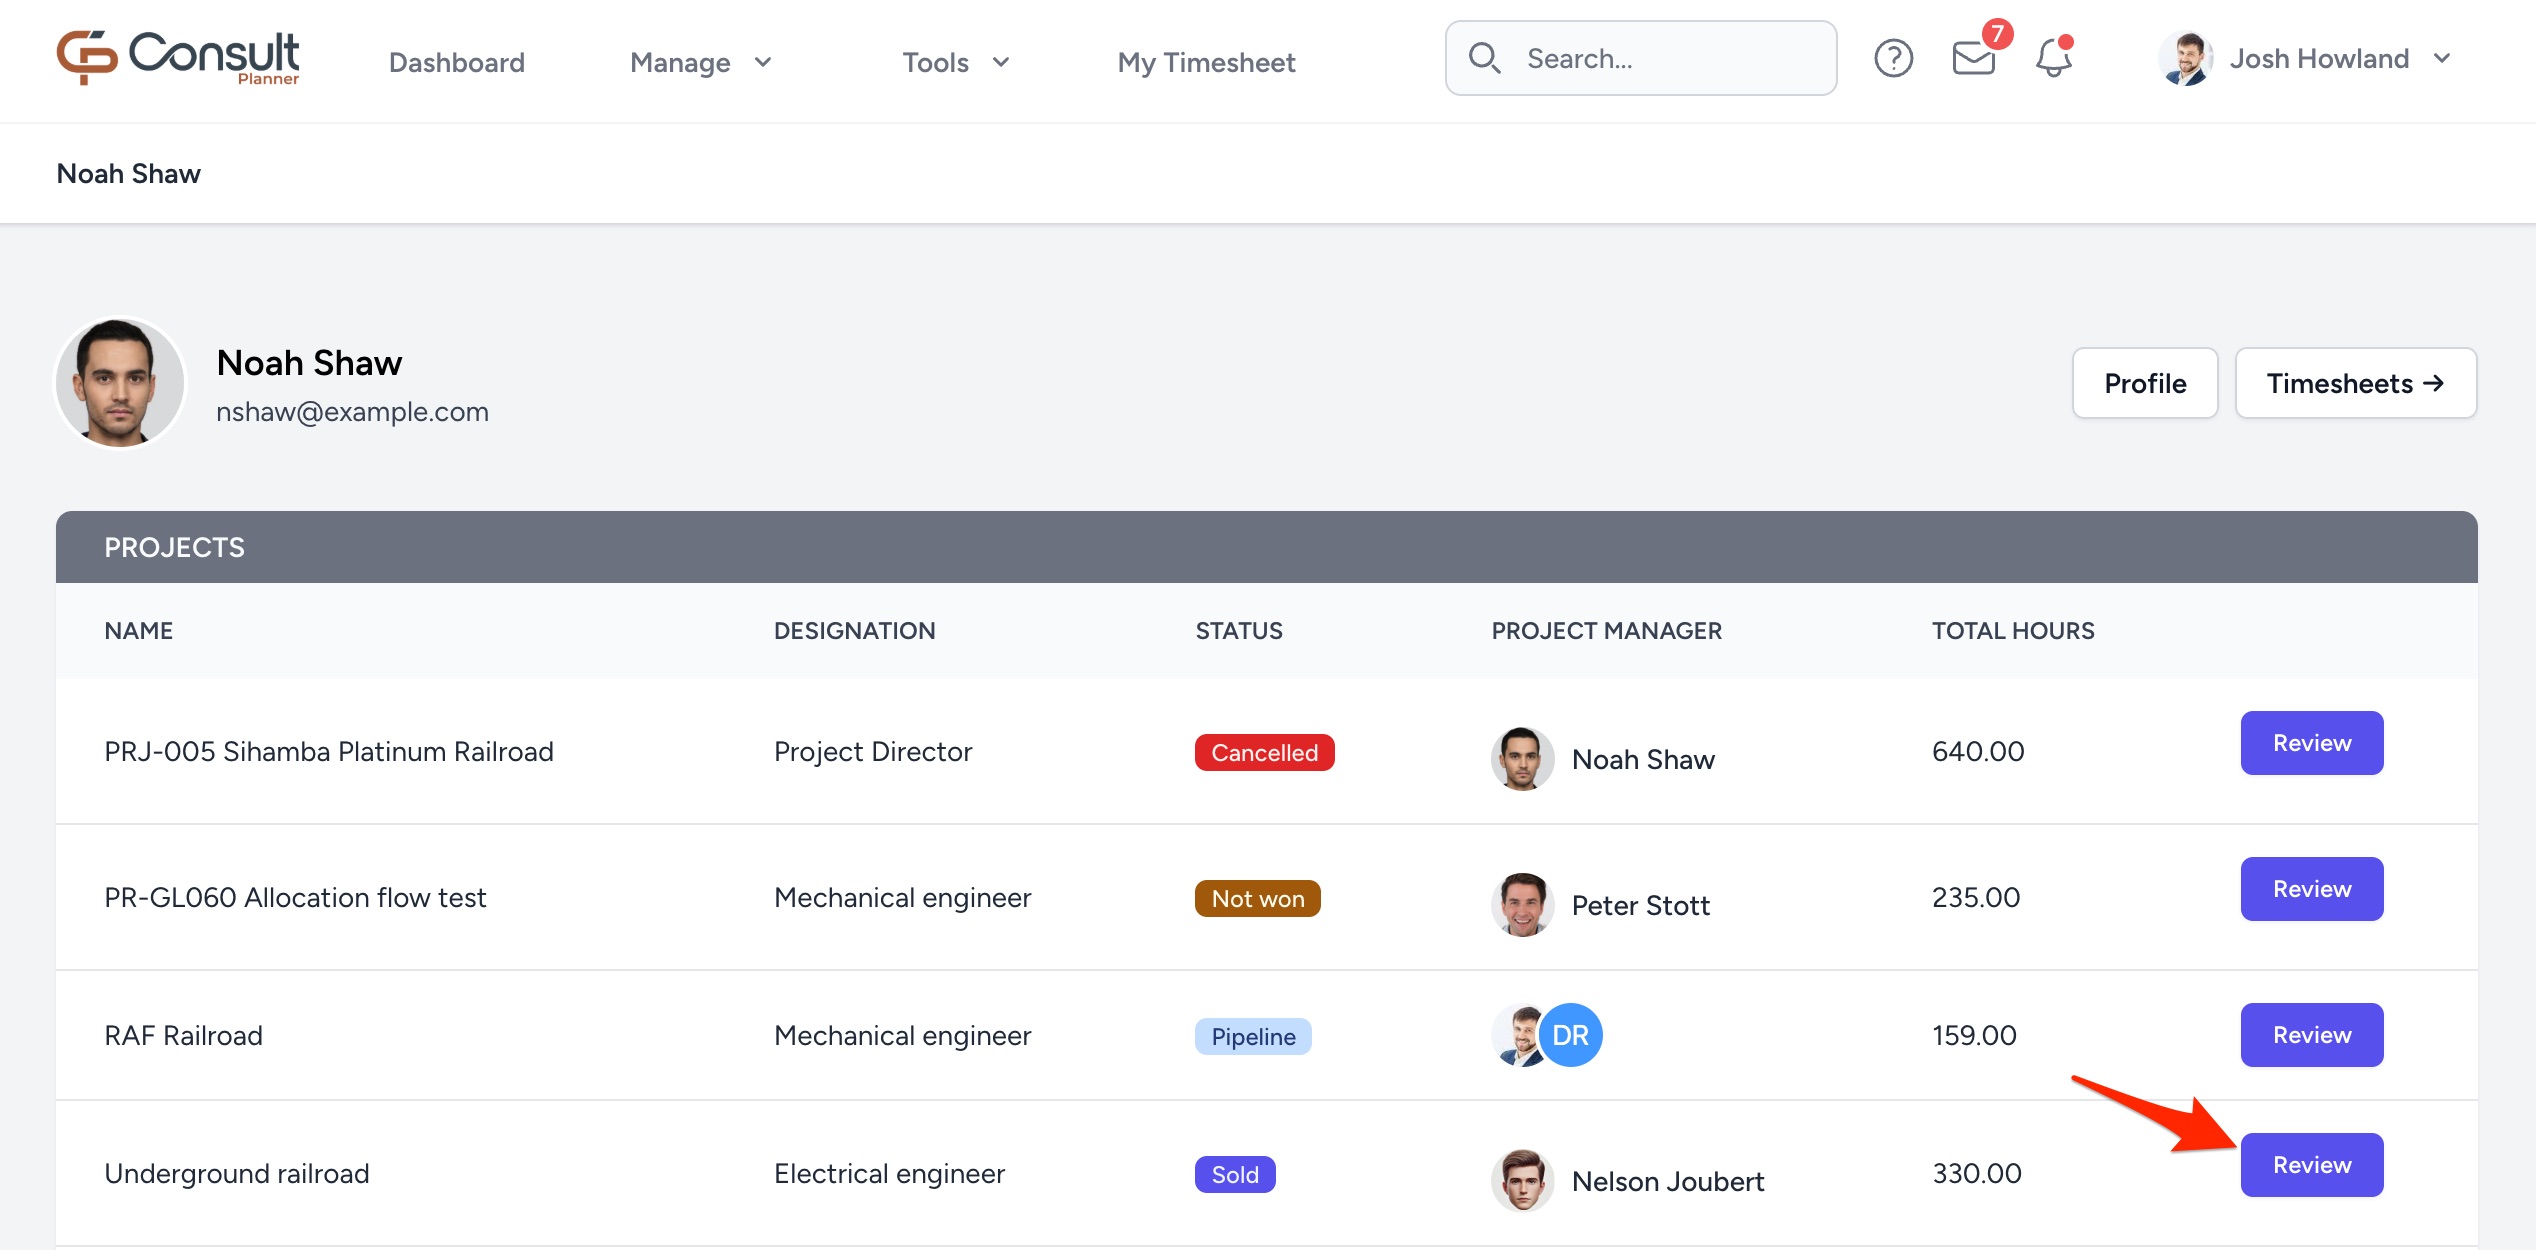
If you select projects, it takes you to an overview of all the projects assigned to the user. To see how the user's hours are allocated across projects, select a reference project and click Review:
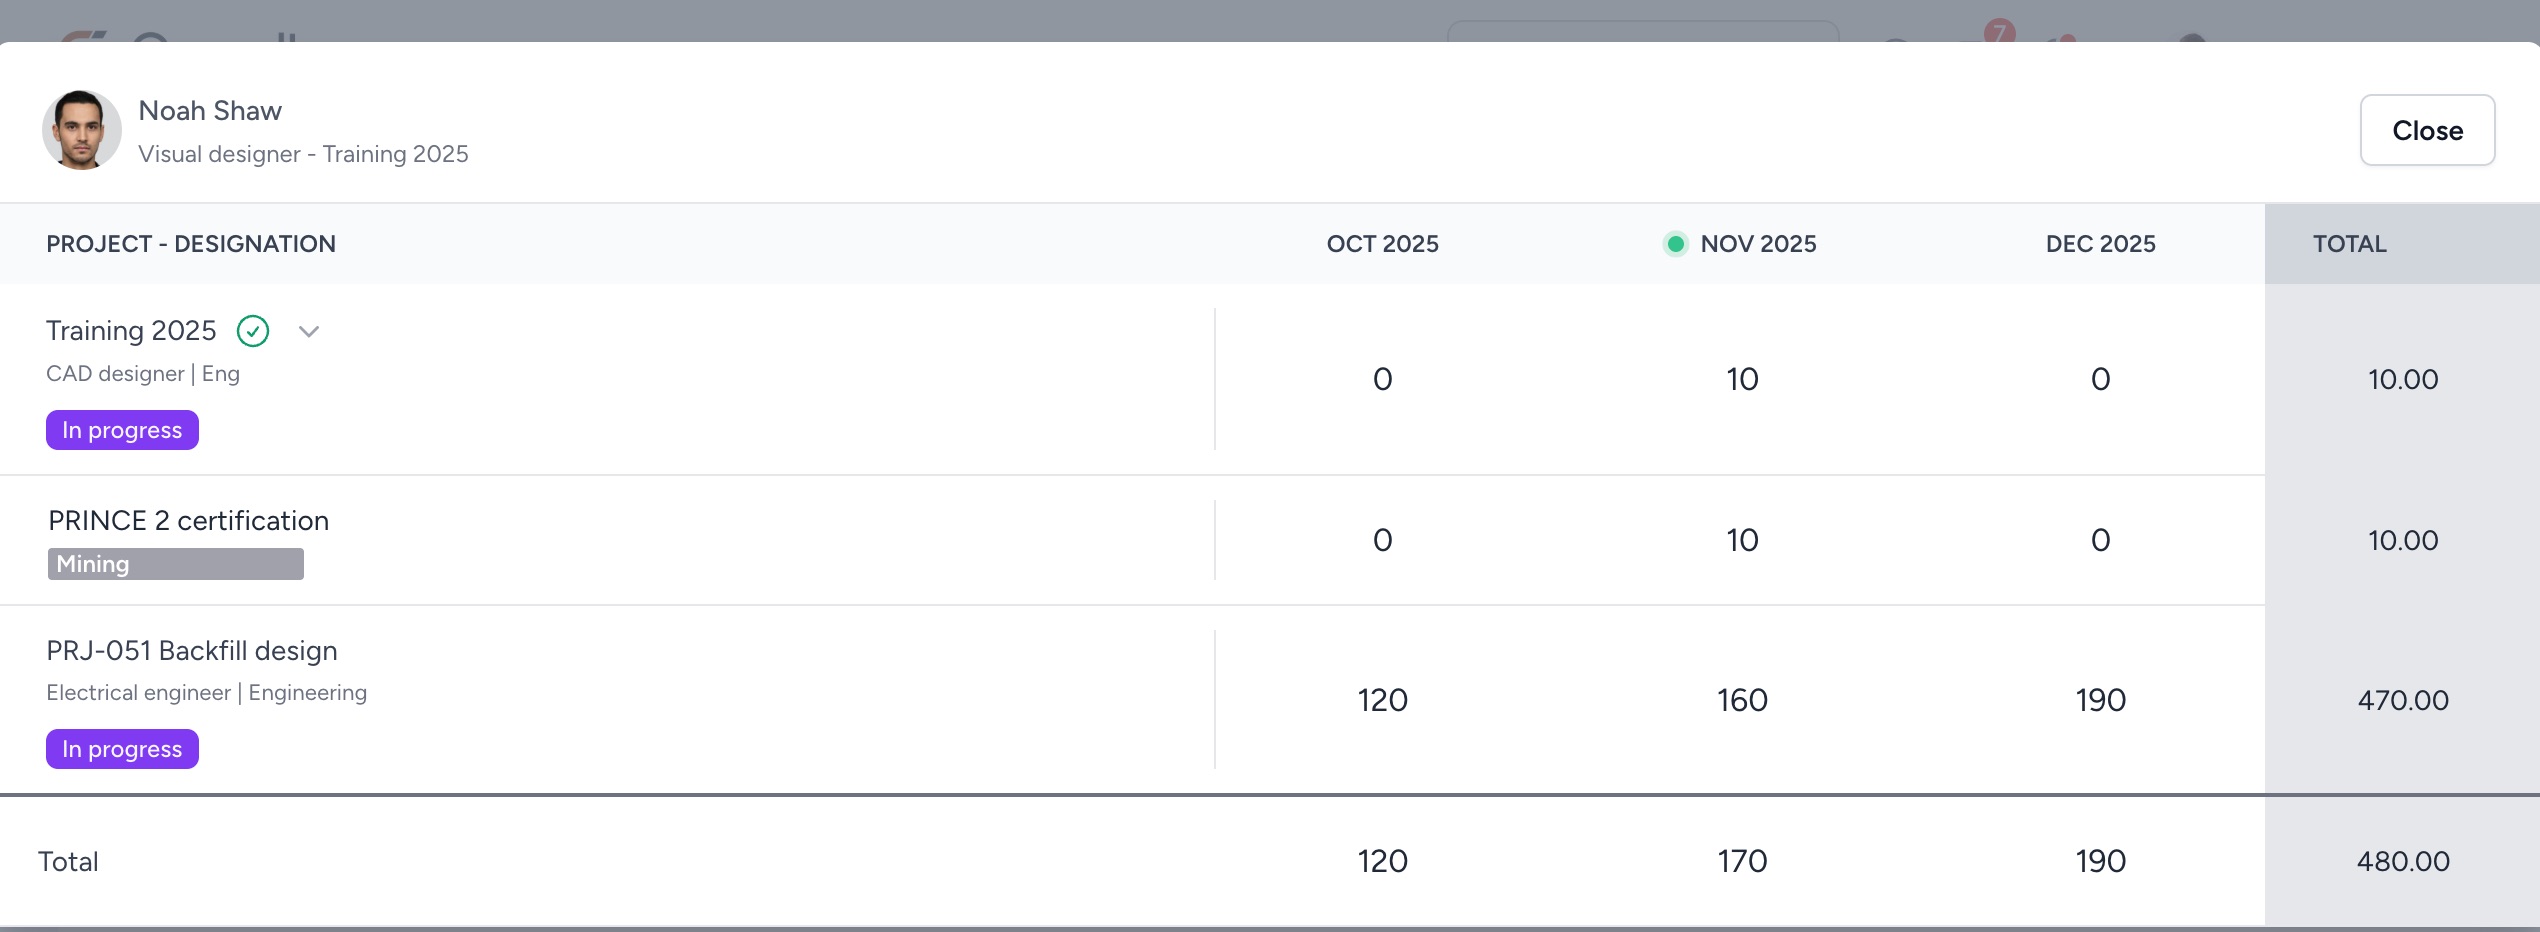
This brings up the resource allocation modal, which shows the distribution of hours across all active projects for the duration of the reference project:
WARNING
Resource managers can edit the hours on this modal. It is important to always discuss changes with the project manager of the affected projects before making these changes.
RM Dashboard | My Organogram
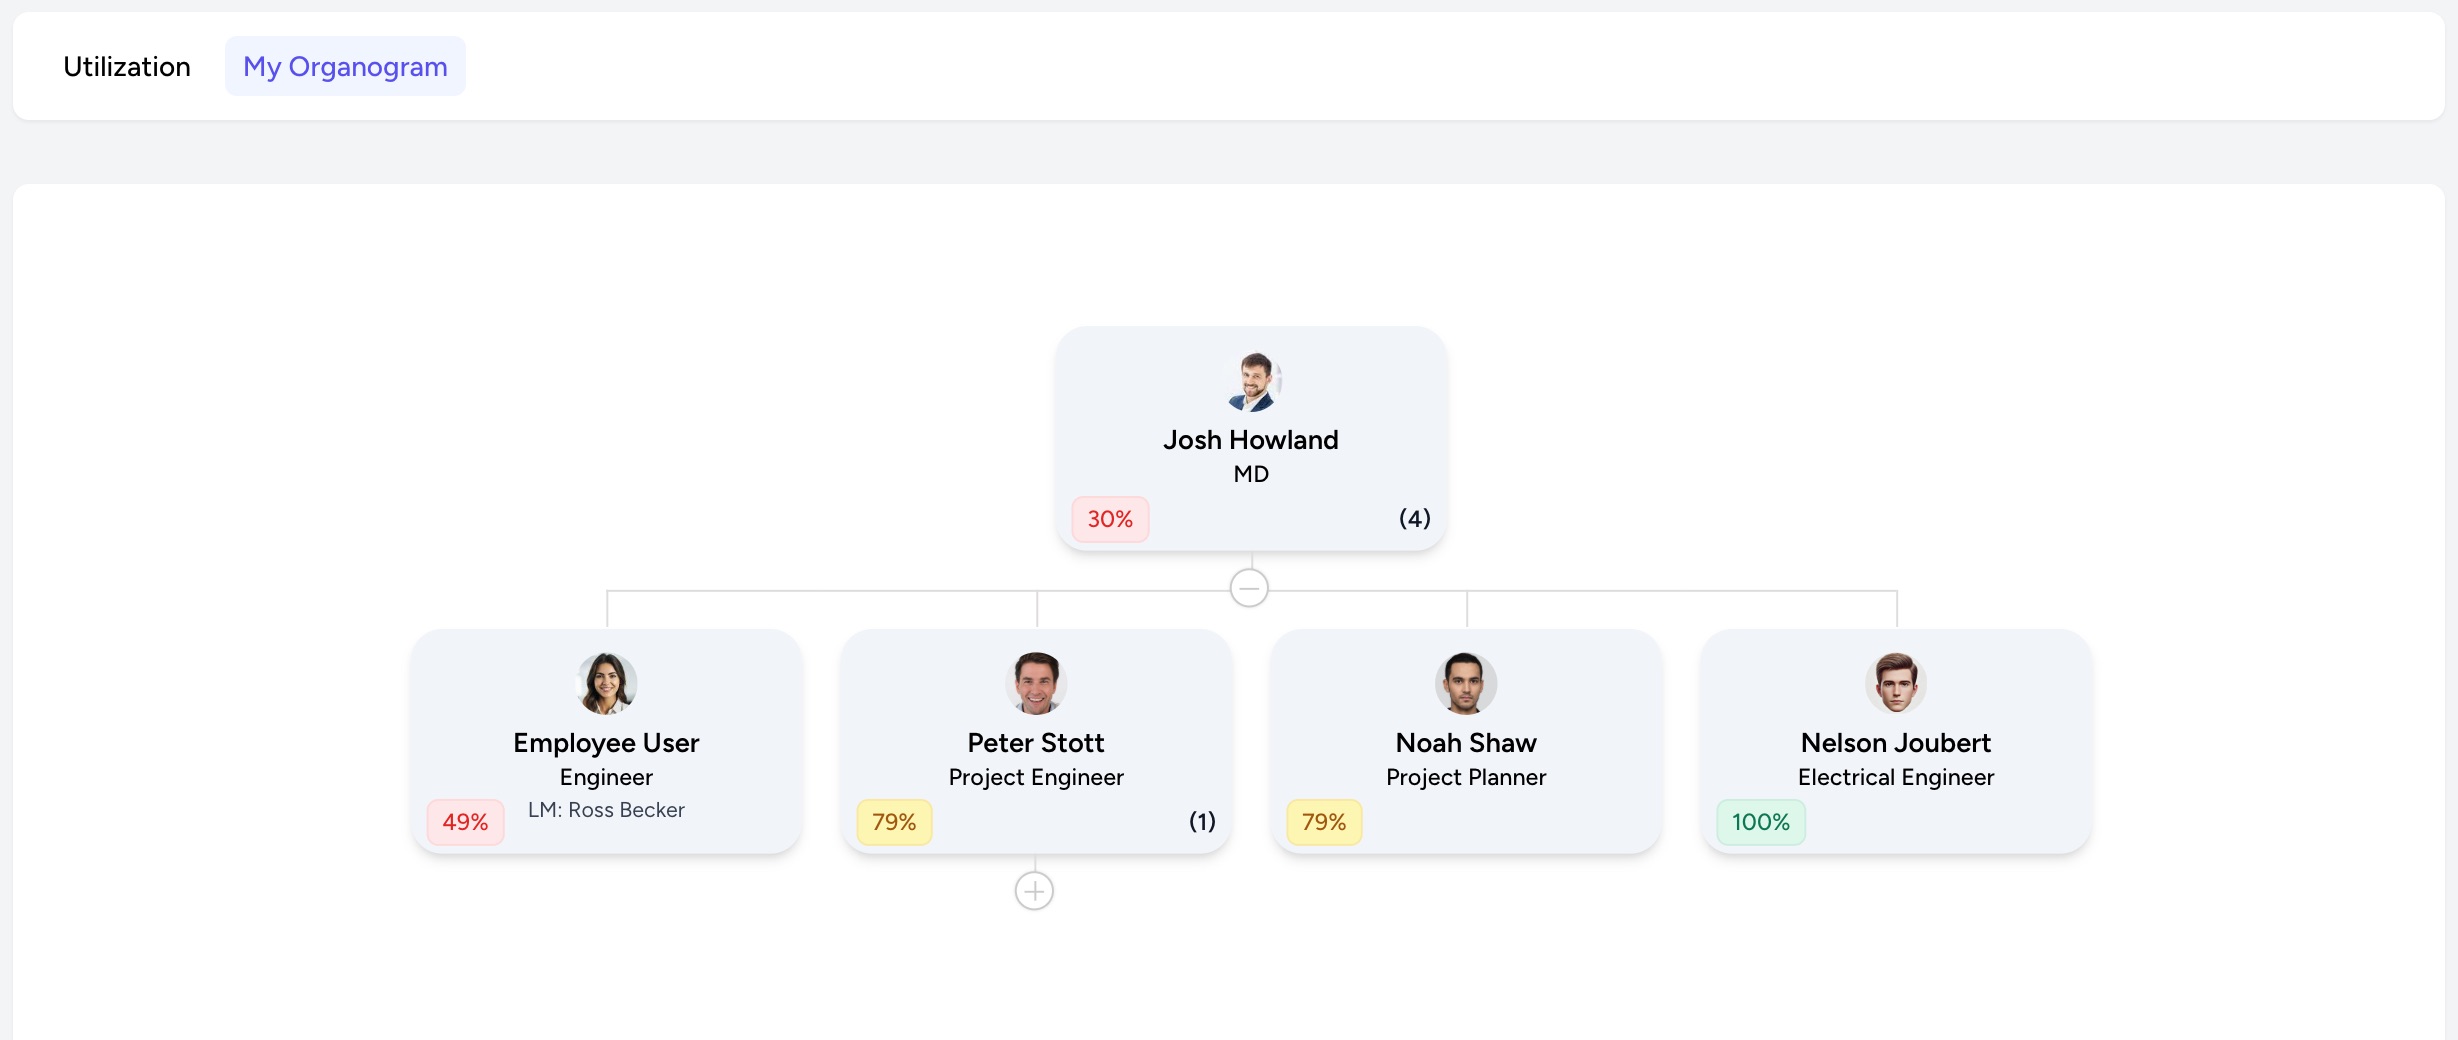
This is a filtered view of the Company Organogram, showing only yourself and your direct and indirect reports. This view also includes a utilization indicator, which looks at the utilization of the past 4 weeks.
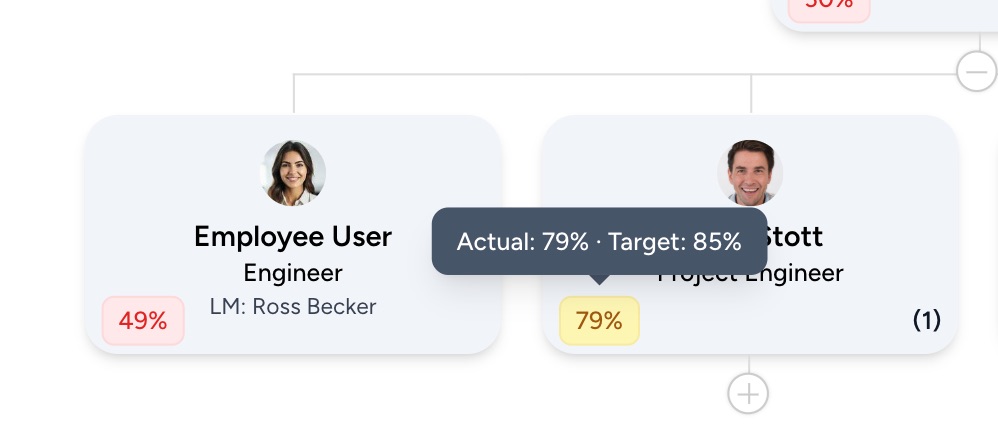
To understand how these values are calculated and what the colors indicate, refer to RM Dashboard utilization calculations.