
Track resource utilisation
Track resource utilisation using the Utilisation Report and the RM Dashboard.
Resource managers have two options for tracking the utilisation of their resources, the Utilisation Report and the RM Dashboard.
Utilisation Report
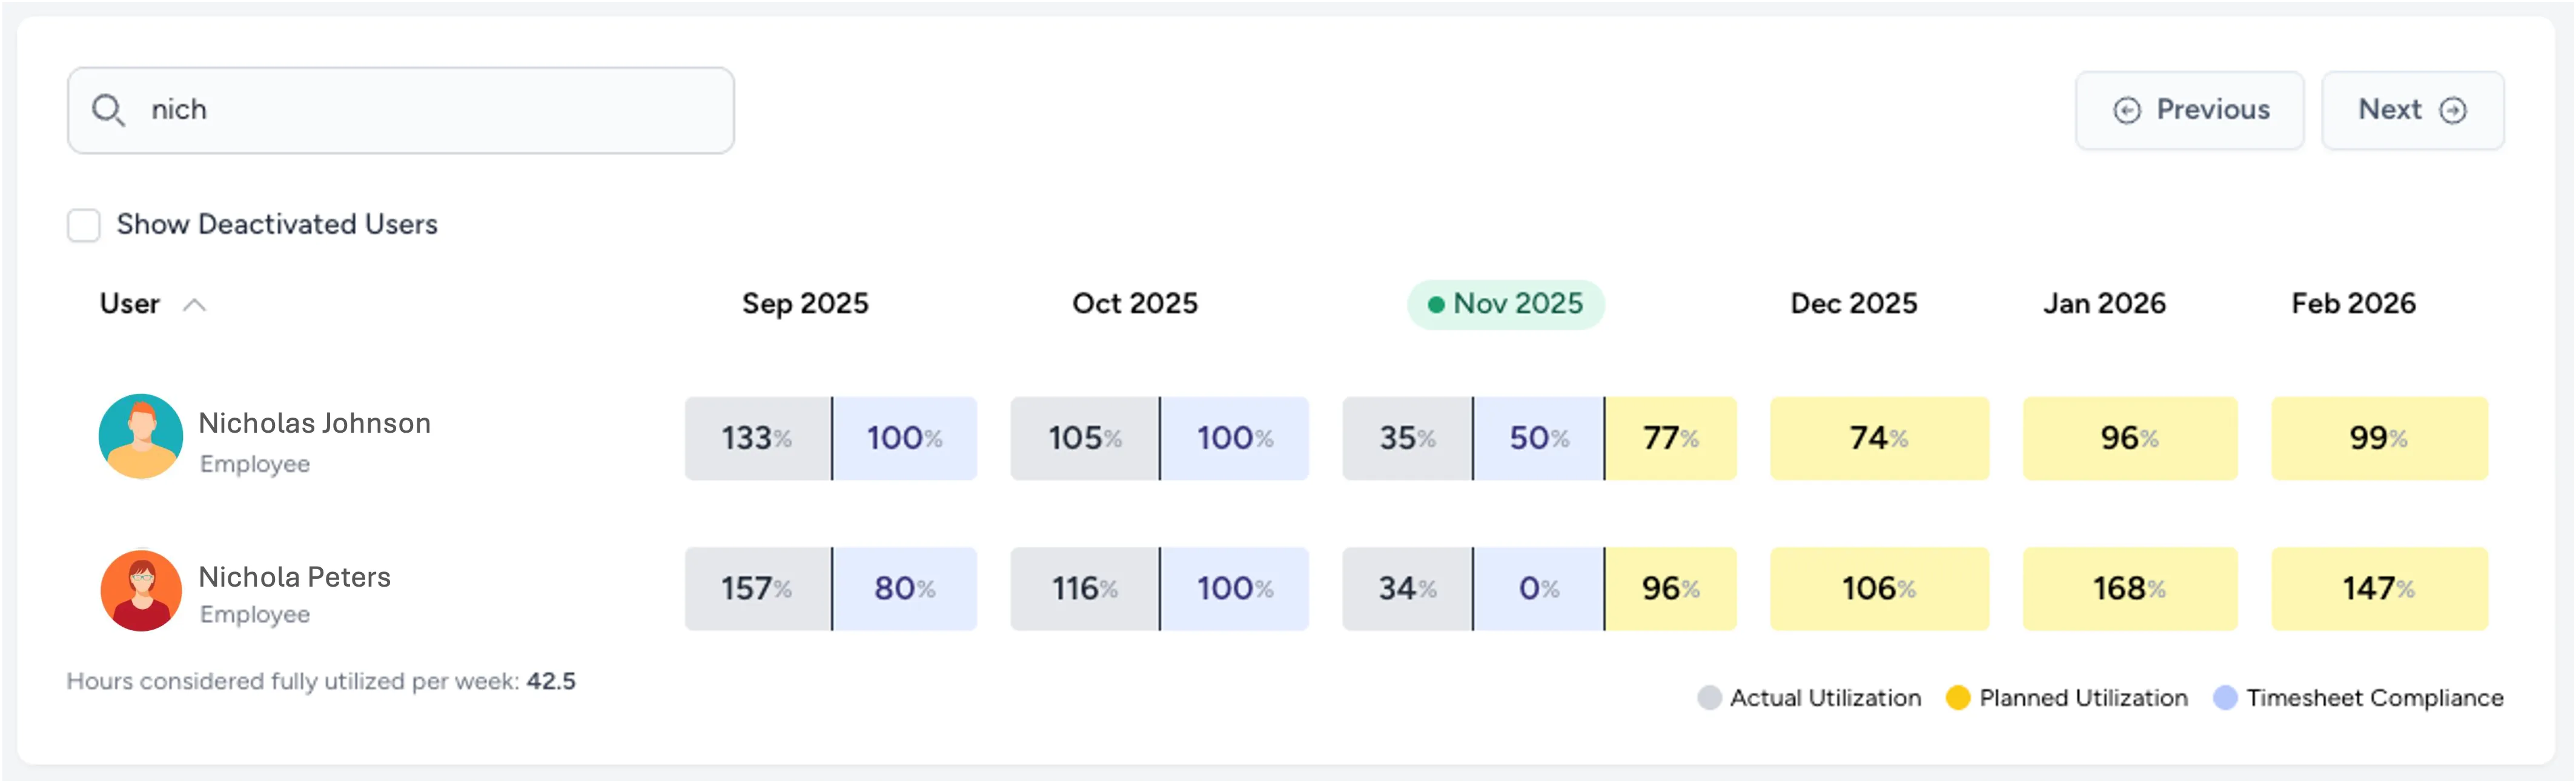
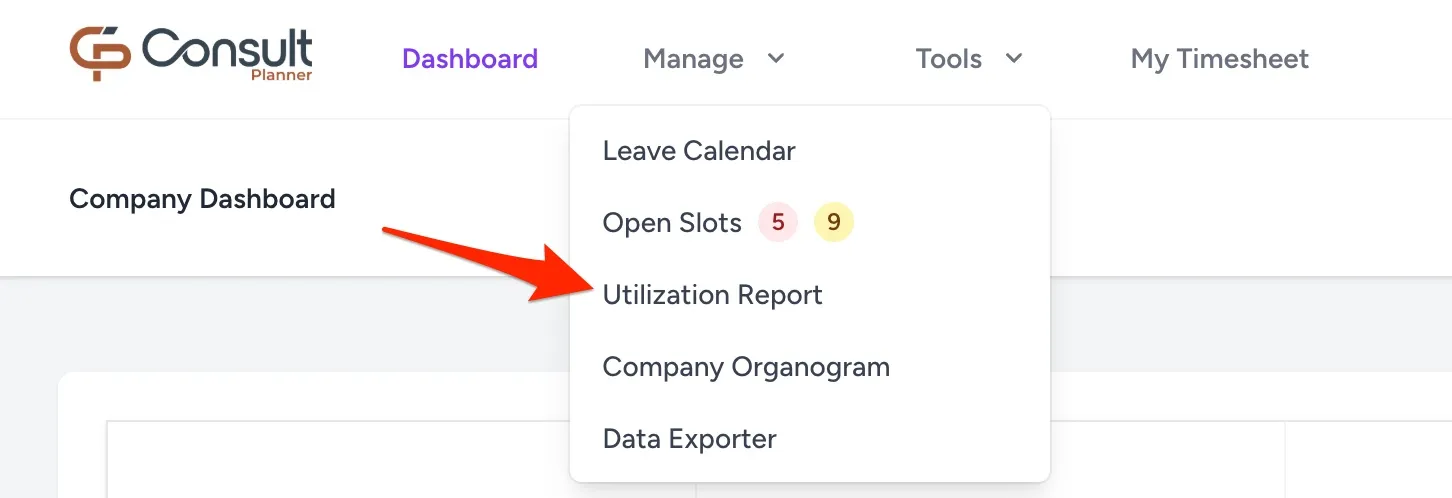
On this report, you can search for any user to see how utilised they have been and how their forecast utilisation looks for the upcoming months. The report is accessed here:
For each user, the following is shown.
Past month utilisation
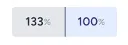
The two values shown for past months are as follows:
- Actual Utilisation in grey: The total hours worked by the user divided by the total number of required hours.
- Timesheet Compliance in blue: The number of approved timesheets divided by the number of timesheets that were due for that month.
Current month utilisation
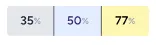
The three values shown for the current month are as follows:
- Actual Utilisation in grey: The total hours worked by the user divided by the total number of required hours, for days in the past.
- Timesheet Compliance in blue: The number of approved timesheets divided by the number of timesheets that were due for that month, for weeks in the past.
- Forecast Utilisation in yellow: The forecast hours on projects divided by the total number of required hours, for days in the future.
Future month utilisation

Only the Forecast Utilisation is shown for future months, which is the forecast hours on projects divided by the total number of required hours for those months.
Note: To understand how these values are generated, see utilisation calculations.
Weeks a timesheet was not due
Compliance only counts the weeks a user was expected to capture time. A week that falls before the user’s start date expects zero hours, so it is left out of the calculation rather than counted as a failure.
Click a compliance value to open the breakdown for that month, where a week that does not apply is shown as follows:
- The Compliant? column shows
-instead of a red cross. - The Required figure is hidden, since no hours were due.
On the report itself, a month in which no week applied shows - rather than a percentage.
The Required figure for a week that does apply is the hours the user was expected to work that week. It accounts for public holidays and for a user who started partway through the week, so it is not simply the required daily hours multiplied by five.
RM Dashboard
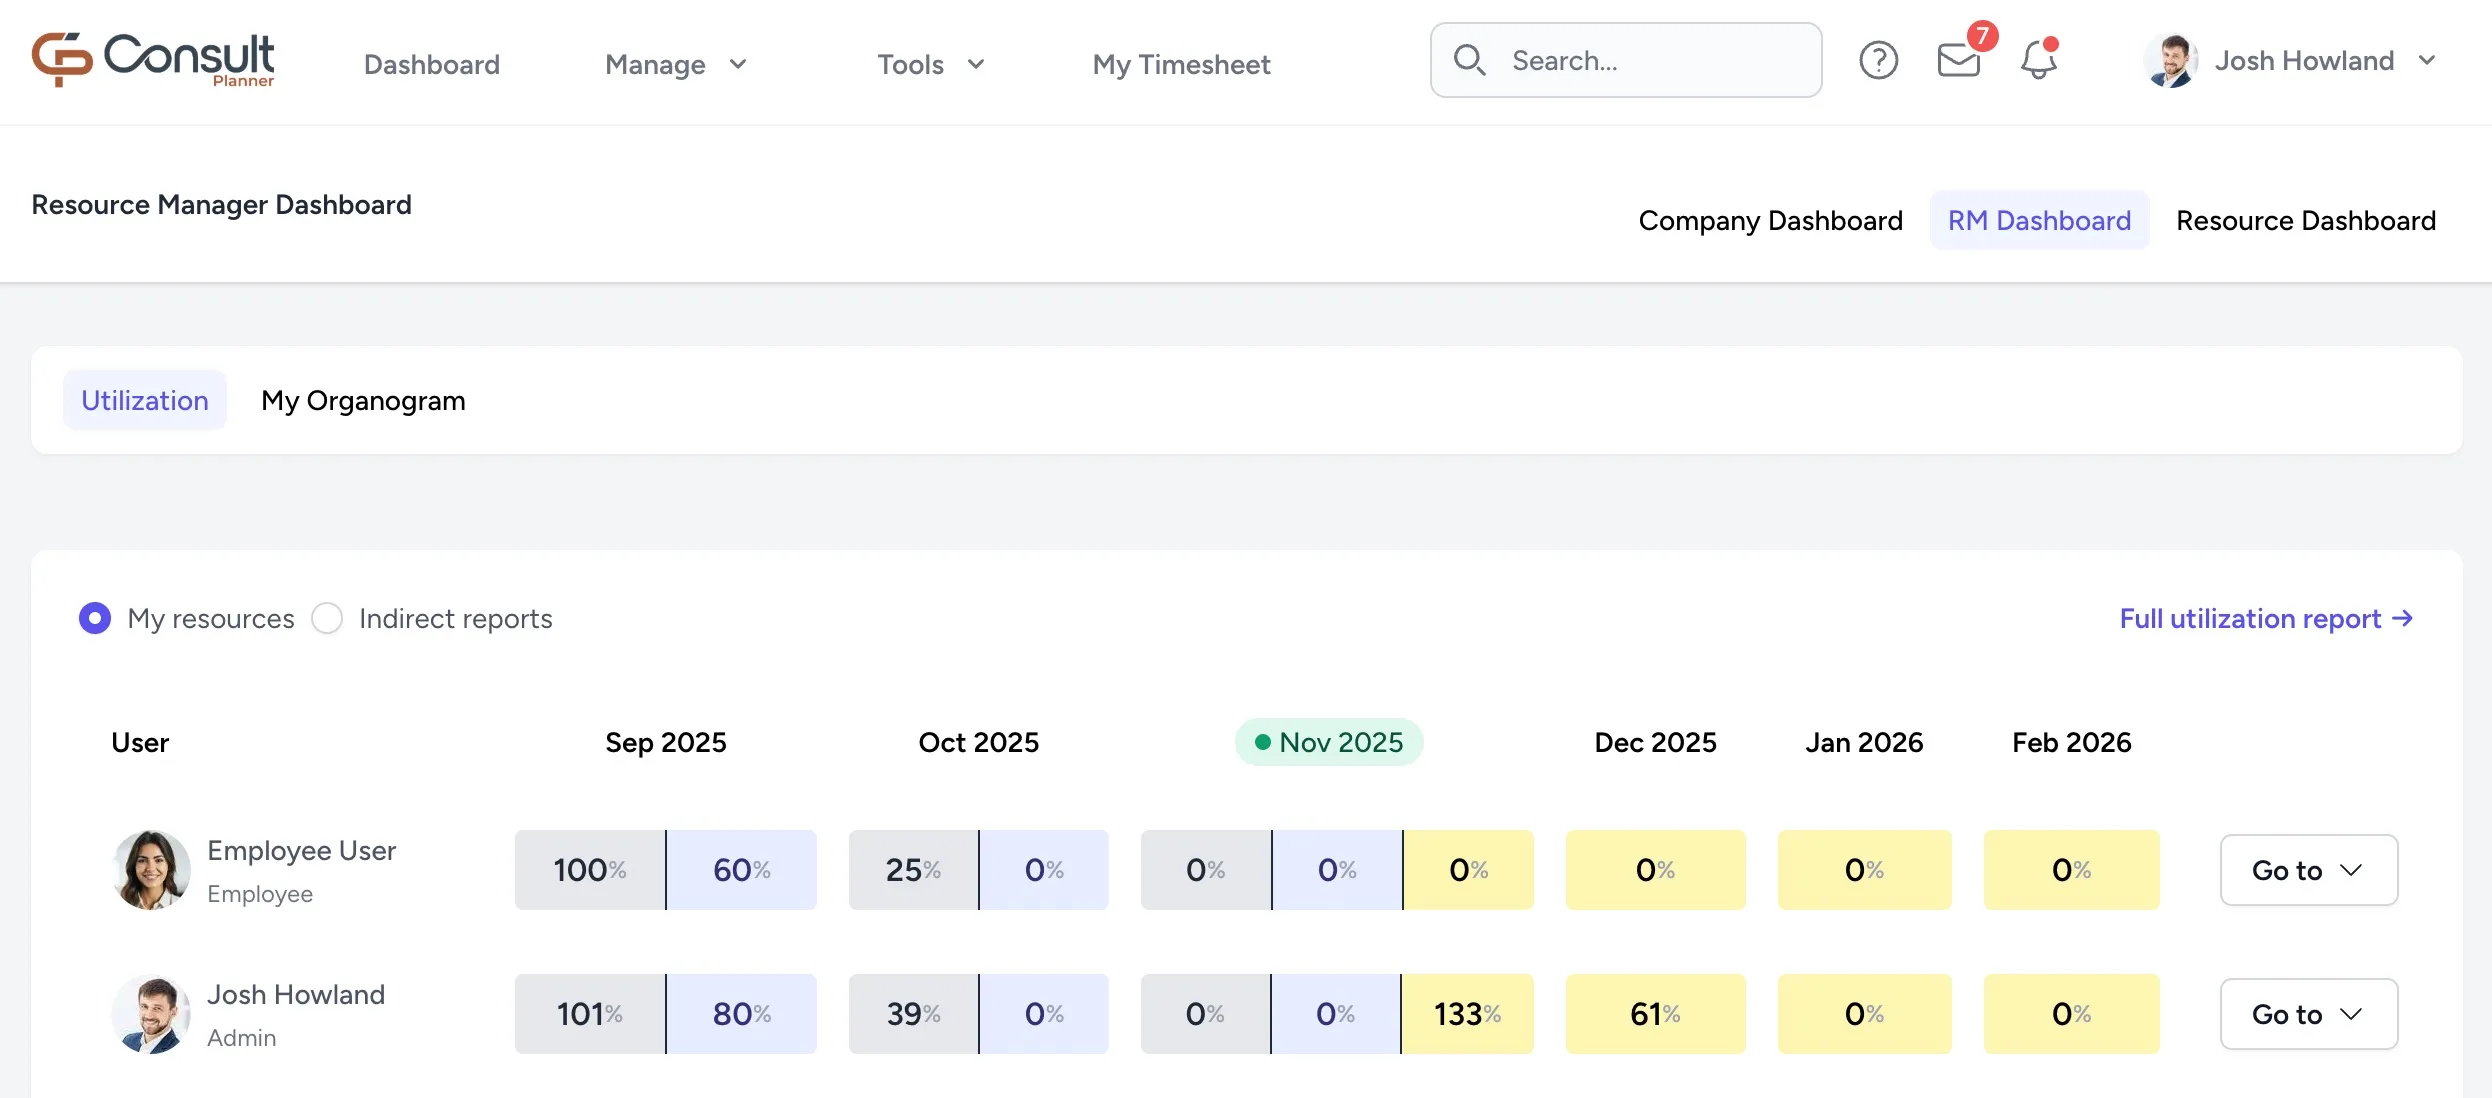
The second tool is the RM Dashboard, which presents information specific to a manager’s direct and indirect reports. See the glossary for definitions.
The RM Dashboard is only available to users who are resource managers to other users. It is accessed from Dashboard > Resource Manager.
Utilisation view
This is a filtered view of the Utilisation Report, showing only the resources applicable to you. Choose My resources for your direct reports, or Indirect reports for the people who report to them.
Both lists include anyone deactivated within the last two months, listed after the active resources, since the utilisation of someone who has just left is still part of the period being read. Someone deactivated longer ago than that drops off the list.
It also gives access to the projects and timesheets of those users:
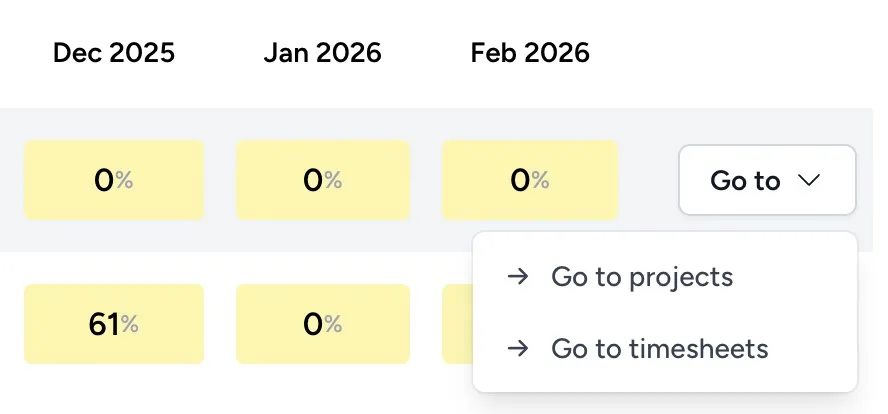
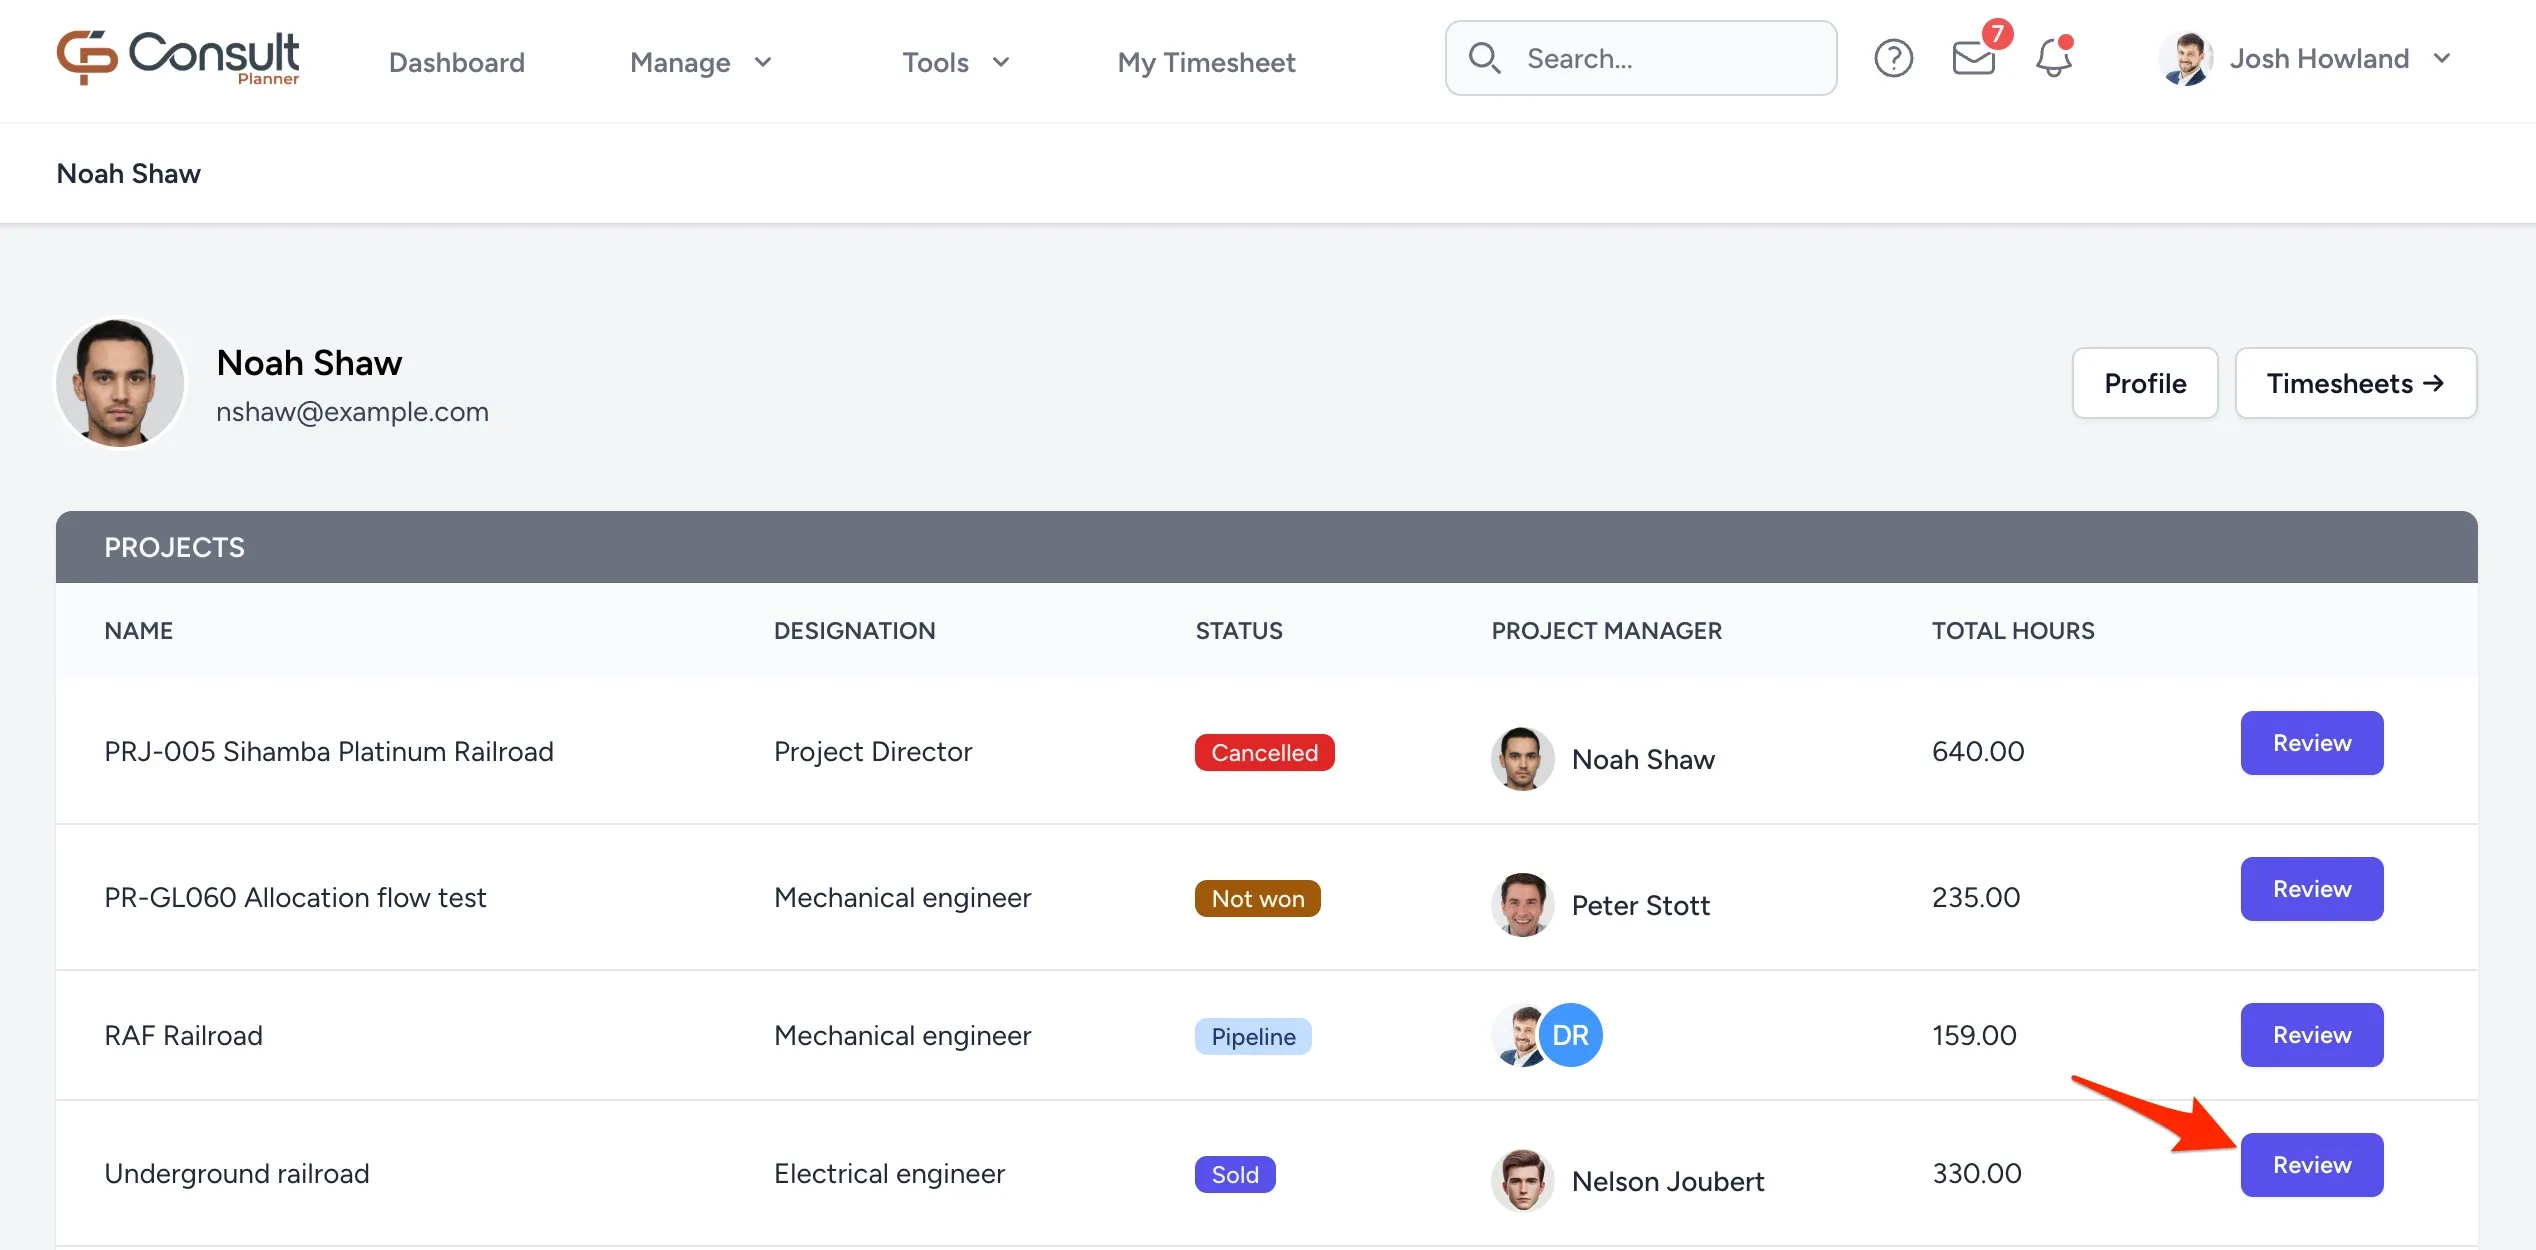
Selecting projects opens an overview of all the projects assigned to the user. To see how the user’s hours are allocated across projects, select a reference project and click Review:
This opens the resource allocation modal, which shows the distribution of hours across all active projects for the duration of the reference project:
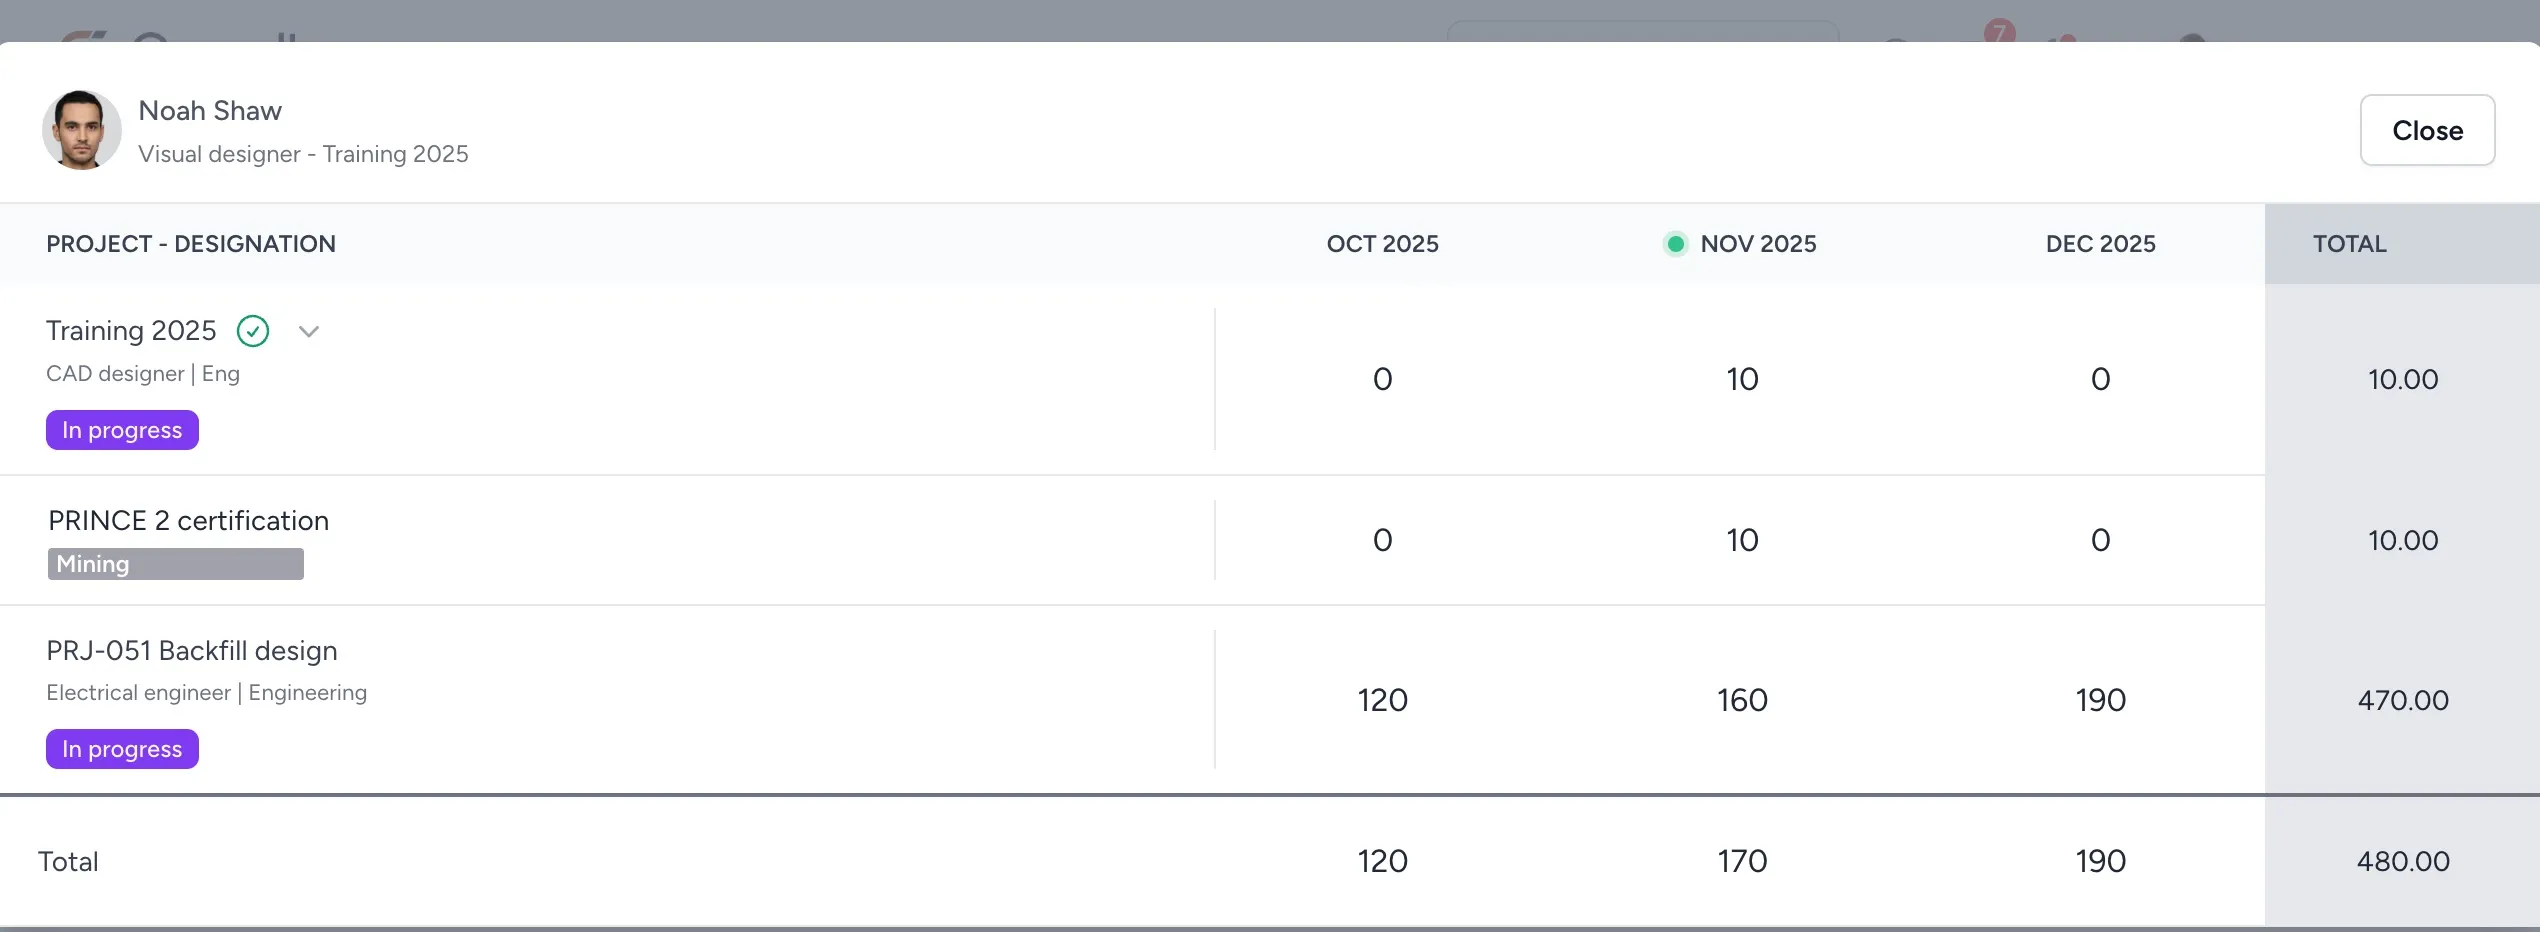
Warning: Resource managers can edit the hours in this modal. Always discuss changes with the project manager of the affected projects before making them.
My organogram view
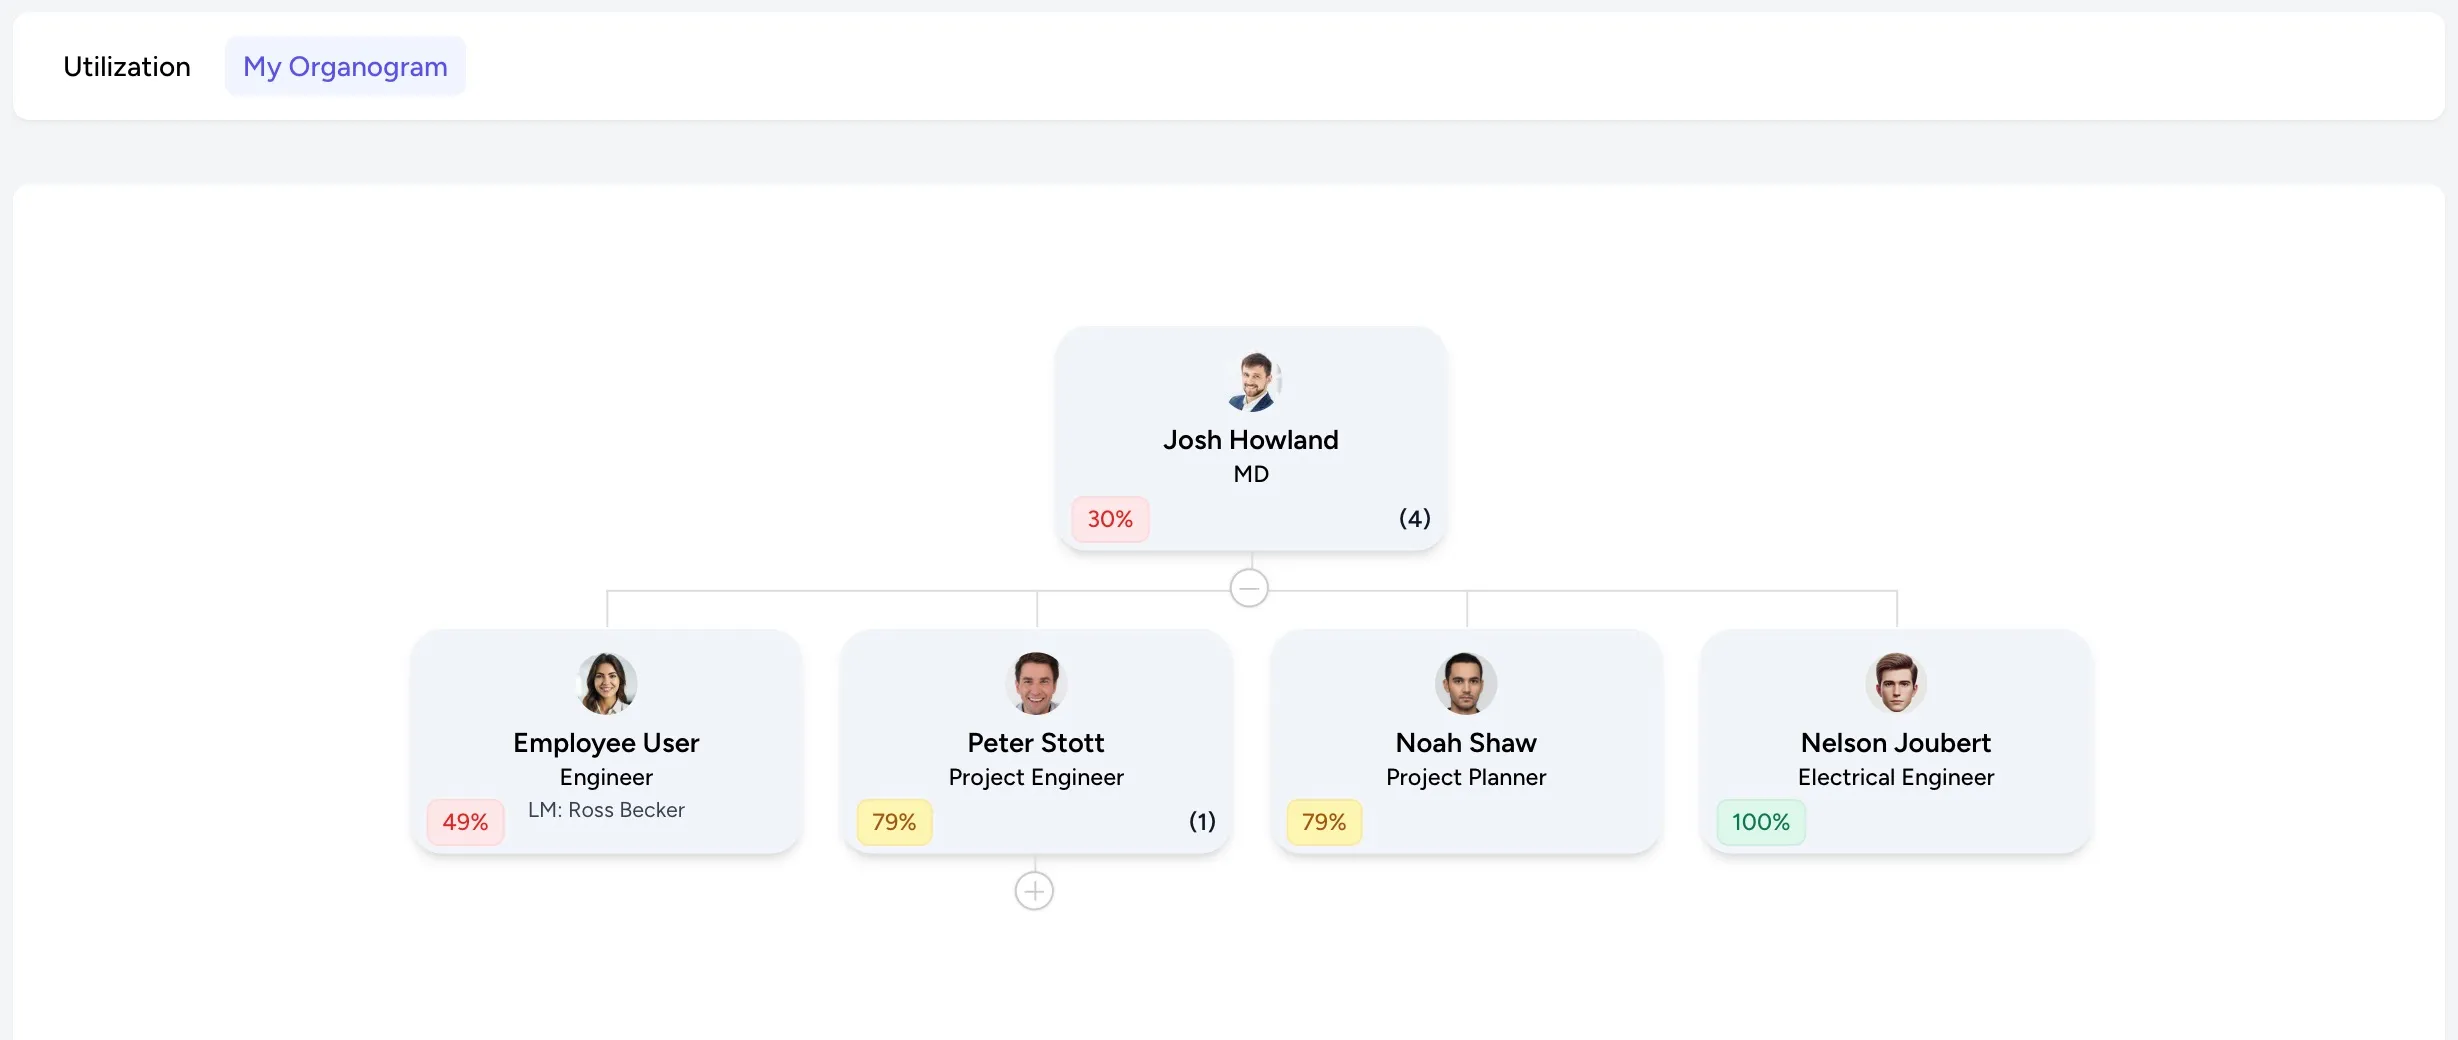
This is a filtered view of the Company Organogram, showing only you and your direct and indirect reports. It also includes a utilisation indicator, which looks at the utilisation of the past 4 weeks.
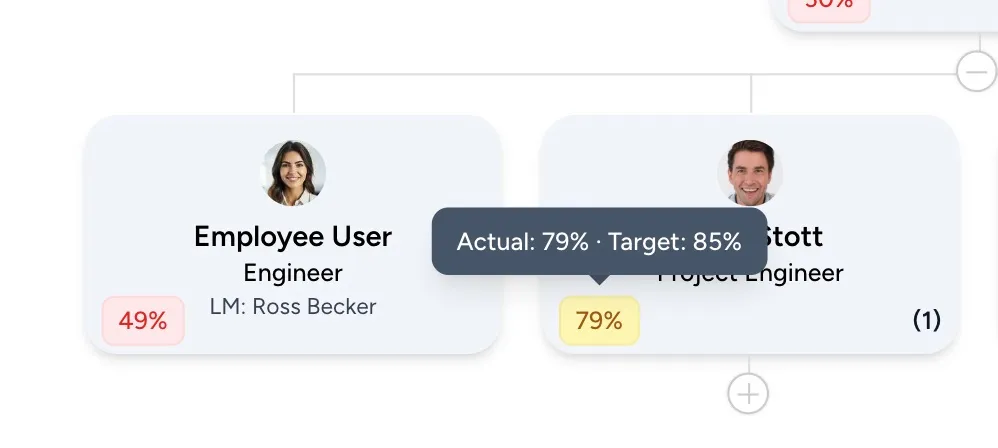
To understand how these values are calculated and what the colours indicate, see resource manager dashboard utilisation.